At the 2022 federal election, Victorians swung away from the major parties, with a 9.2% decline in the major party vote in the House of Representatives and a 3.3% decline in the Senate. This decline hit the Liberal/National Coalition harder than Labor, with two-party swings of 1.4% to Labor in the House and 5% to Labor in the Senate. I calculated the two-party-preferred from the Senate vote by finding the highest ranking for each party (Labor/Coalition) and its candidates (including below-the-line votes).
So for example, if someone ranked the third Labor candidate 2nd, then the first Liberal candidate 4th etc, that would be counted as the ballot showing a preference for Labor over the Coalition.
After adding up all the votes for each party/grouping, I then divide the total for each party/grouping by the total number of votes who marked a preference for at least one major party/grouping, or its candidates.
Note that I only count rankings for parties which are formally part of the Liberal/National Coalition. e.g. votes in Western Australia and South Australia which went 1 National 2 Labor 3 Liberal were counted as preferring Labor over the Coalition, as the WA and SA branches of the National Party are not affiliated with the Liberal/National Coalition.
(Of the WA/SA National MPs elected in recent history, the sole WA National elected federally said to not count him as part of the Coalition, while SA National Karlene Maywald backed in a Labor government at the state level, so it’s reasonable to not count votes for the WA/SA Nationals as automatically being part of the Coalition.)
It doesn’t have much impact on the two-party-preferred estimate given that neither the WA or SA Nationals typically win many votes. And in this piece, it doesn’t matter at all since the Victorian Coalition runs a joint ticket.
The code I used to calculate the Senate 2pp by state is up here: https://raw.githubusercontent.com/ArmariumInterreta/Armarium/master/FederalResultToState/Calculate%20Senate%202pp%20Vote%2C%20Federal%202019.r. Note that you’ll need to download the datafiles separately from the AEC Tally Room website. This resulted in the Liberals losing two seats to Labor (Chisholm + Higgins) and two seats to independents (Kooyong + Goldstein), as well as one in every five Victorian federal electorates being major party versus minor party/independent contests (i.e. “non-classic”). Specifically, Cooper (ALP/GRN), Goldstein (IND/LIB), Indi (IND/LIB), Kooyong (IND/LIB), Melbourne (GRN/ALP), Nicholls (NAT/IND), Wannon (LIB/IND) and Wills (ALP/GRN), or 8/39 seats.
Additionally, Macnamara (LIB/ALP/GRN), Mallee (NAT/ALP/IND), Higgins (LIB/ALP/GRN) and Fraser (ALP/LIB/GRN) came within 0.7%, 2.1%, 4.8%, and 5.3% of becoming non-classic contests.
This result produced some speculation of what would happen at the Victorian state election if the patterns of the 2022 federal election were repeated; in particular attempts to translate results in particular federal electorates to the state level. The problem with this is that the vote for any party or candidate is rarely evenly distributed throughout an electorate; as an example, let’s look at the Division of Ryan:
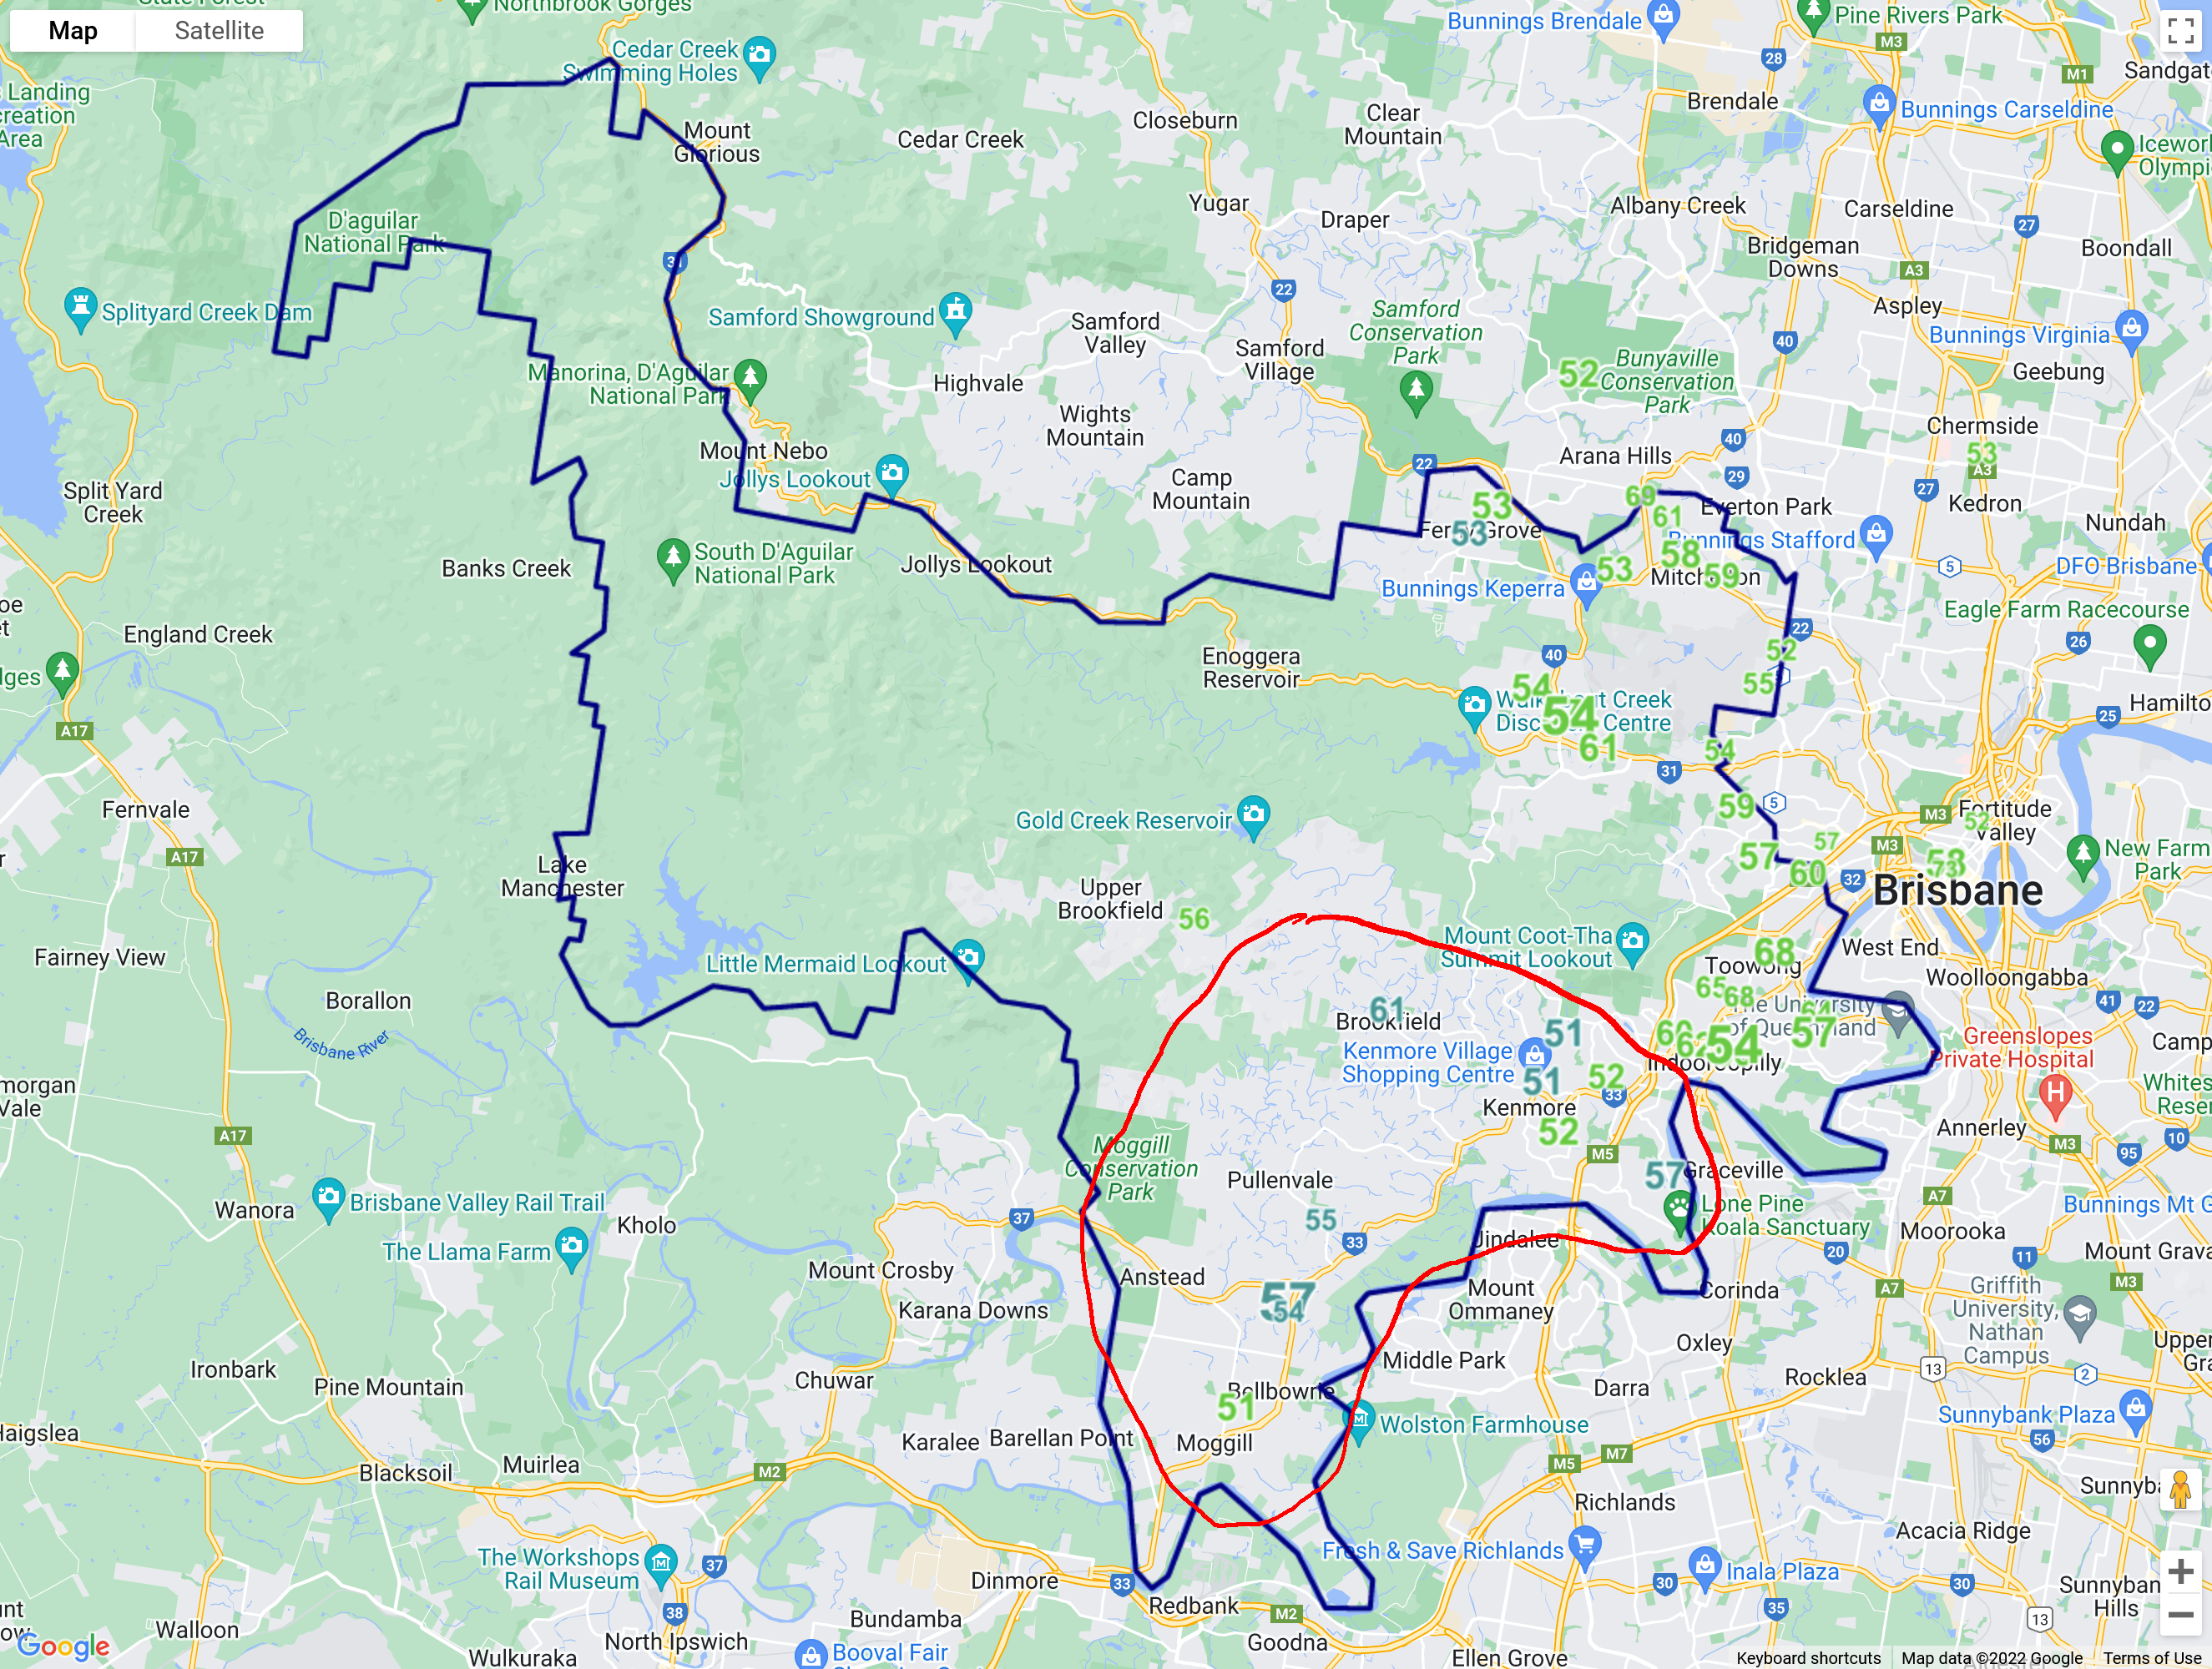
The Division of Ryan saw a big uptick in the Green vote at the federal election, with the Greens making it into the final two and flipping the seat. However, if there was a state electorate in the area circled in red, it would be rather LNP-leaning despite being entirely contained within the Division of Ryan; claiming that a state electorate of Red Circle would be Green-leaning would not be accurate.
Hence, if we want to project any results from the federal election onto the upcoming Victorian state election, we need to first redistribute the federal result to the state electoral boundaries. Here, I use a model provided by Ben Raue (of the Tally Room) to redistribute the federal results to the SA1 (Statistical Area Level 1) level, then use enrolment data provided by the Victorian Electoral Boundaries Commission to estimate the federal result for each state electoral district. This has the slight disadvantage of not taking into account voting rates – turnout isn’t equal between electorates, and there are some trends in how turnout differs between electorates (e.g. electorates with higher numbers of Indigenous/Torres Strait Islander voters).
It shouldn’t have much impact on the projected results, however, as those differences should already be factored into the federal result. We can then project those results onto the last state election to get an idea of how trends seen at the federal election might play out at the state level.
A Look at Your Houses
However, there’s a bit of a snag – at federal elections (and most state elections), voters cast two ballots, one for each house of Parliament. Hence, there’s two “results”, one for the single-member House of Representatives (lower house) and one for the proportionally-represented Senate (upper house); while many voters vote similarly for both houses, this isn’t always the case. In particular, there may be differences between the House and the Senate in the candidates/parties running in a particular area, or voters may be willing to vote for a candidate from a particular party in the House, but decline to vote for that party in the Senate (aka personal vote effects).
Hence, we’re going to analyse the results in the House of Representatives result, while a follow-up (likely after the state election) will go through the Senate result. Both results have their own unique foibles which influence how they are to be interpreted – results in the House are subject to greater candidate effects and differences in the parties running in each electorate (e.g. One Nation did not run a candidate in Higgins), while major parties typically get a lower share of the vote in proportionally-represented upper houses like the Senate, For example, at the 2018 Victorian state election, the combined major-party vote in the Legislative Assembly (lower house) was 78.05% while it was 68.64% in the Legislative Council.
Similarly, at the 2019 federal election, the major parties won 75.44% in the House of Representatives but 67.02% in the Senate. The gap was much smaller at the 2022 federal election but still there, with the majors combining for 64.93% in the House and 63.74% in the Senate. making it harder to project Senate results to lower house electorates.
We’ll look at the first-preference vote and how it shifted for the four largest parties/groupings: Labor, the Lib/Nat Coalition, the Greens, and Palmer’s UAP (all of whom ran candidates in every Victorian electorate). We’ll also be analysing the geographic distribution of the vote for Independents who won above 10% of the first-preference vote at the federal election and the change in the two-party-preferred between the 2019 and 2022 federal elections.
Before we go further, I should note that directly projecting federal results onto state results or vice versa is often a risky business; voters are very capable of distinguishing the two. That being said, broader trends in how certain areas shift towards or away from particular parties tend to be reasonably similar at the state and federal level.
For example, on a two-party basis, Malvern swung from voting 58.6% Liberal in 2019 to 52.2% Liberal in the 2022 federal election. This doesn’t mean that there will be a 6.4% swing to Labor in Malvern at the upcoming state election or that the Liberal two-party vote will fall to 52%. However, unless the swing appears to be the result of unusual candidate factors, we might expect that Malvern has become less Liberal-leaning between the two elections. Depending on the statewide popular vote, this could play out as no swing to the Liberals in Malvern even as they gain votes statewide, or Labor gaining a two-party swing amidst a statewide decline in the Labor vote, or Labor gaining a larger swing in Malvern to them than the rest of the state. When looking at this kind of data, it’s more useful to look at how an electorate shifted relative to the rest of the state than to directly project results from elections at one level of government to another.
Anyways, on with the show!
The Pattern of Primaries Across The State
Labor
Outside of a couple of regional strongholds, Labor’s vote in Victoria is strongest in western Melbourne:
However, switch over to the swing option and the story from the 2022 federal election becomes a little more muddled. While Labor still won landslide victories across western Melbourne, it also suffered a wall of negative swings in blood-red territory such as Scullin (at the federal level), or Mill Park and Thomastown at the state level. Unlike the negative swings against the Liberals – which we’ll get to later – voters who shifted away from Labor didn’t coalesce behind a single, viable alternative. For example, the 14.2% net decline in Labor’s primary in Scullin translated into a 4.3% swing to the Green, a 3.1% swing to the Palmer UAP candidate as well as 6.5% and 3.8% going to the new One Nation and LDP candidates respectively.
Another key feature is that the size of the decline in Labor’s primary was negatively correlated with Labor’s primary in those electorates at the 2019 federal election:

The distribution of swing meant that Labor was able to avoid (however narrowly) losing any electorates in Victoria due to its worst swings being concentrated in seats where Labor either had lots of buffer (e.g. Scullin – 71.7% 2pp in 2019) or wasn’t in the running for the seat anyway (e.g. Goldstein). On the other hand, Labor managed to hold up reasonably well in marginal areas + areas where it had under-performed in 2019, assisting it in gaining two seats off the Coalition. The same cannot be said of the Coalition, whose performance in both its marginals and its ‘near-marginals’ cost it several seats:
Liberal/National Coalition
The Coalition’s vote is strongest in the regions, as well as in a band across eastern Melbourne in seats like Rowville and Malvern. Unfortunately for the Coalition, the latter swung hard against them, flipping Higgins to Labor and tossing out Liberal incumbents in Kooyong and Goldstein:
The primary vote swing across eastern Melbourne is particularly notable due to the number of blue-leaning “nearly marginals” concentrated in that area – think electorates like Bulleen, Malvern, Rowville and Evelyn. These are all electorates which are Liberal-leaning relative to the rest of the state – the Liberals held them despite Labor’s strong performance at the last state election. However, if eastern Melbourne swings away from the Liberals at similar rates to that seen at the 2022 federal election, those seats could flip (Rowville, Bulleen, Evelyn) or become extremely close (Malvern, Kew).
The flip side of this is how the Liberals held their own in seats where they normally get pummeled by Labor. While very few state electorates saw large swings to the Coalition candidate on primary votes at the federal election, The notable exceptions are Mildura, located wholly in the federal Division of Mallee, and St Albans, located in western Melbourne. Coalition candidates either tread water or made small gains on first preferences across western Melbourne, resulting in their 2019 vote/2022 swing graph looking like an interesting inversion of Labor’s:

Unlike Labor, the Coalition was unable to hold down the swing in electorates which were Coalition-leaning but not very safe, leading to the loss of Kooyong and Goldstein to independents while coming very close to losing Aston, Menzies and Wannon. Taken together with Labor’s underperformance in its strongholds, the 2022 federal election may herald a period of electoral depolarization in Victoria, where historically-safe seats for both sides become winnable for another candidate.
While the two major parties win the most seats, more Victorians voted for a minor party or independent candidate at the 2022 federal election than for either major party (34.05%, versus 33.08% for the Coalition and 32.85% for Labor). Hence, let’s look at how the two largest minor parties fared at the federal election:
Greens
As you might expect, the Green vote in Victoria is strongest in the inner city, with a contiguous block of electorates in inner west Melbourne showing up as solid green:
The picture gets a little more interesting if you toggle the map to look at the change in the Greens’ primary vote between federal elections instead. Across the state, the Greens gained a +1.85% swing to them on first preferences, a significant chunk landing across the outer suburbs and in southwest Victoria. This would likely have been higher had the various teal independents not run; of the seven state electorates where the Green vote declined by more than 1%, six were primarily composed of voters in areas with a strong independent campaign (Hawthorn, Kew, Sandringham, Brighton, South-West Coast, and Shepparton).
As Green gains on the primary vote did not land in their marginals, the pattern of swing from the federal election would be unlikely to net the Greens many seats if replicated at a state level. Of the state electorates which swung to the Greens at the federal election, only Northcote (GRN +6.4%) would definitely flip to the Greens if the federal swing was applied to the 2018 result. Other electorates of interest are Albert Park, Pascoe Vale and Footscray, where the Greens perform much better at the federal level than they do at the state level; if they could replicate their performance at the 2022 federal election there, they would have a strong chance to flip those seats.
Unlike Labor and the Coalition, the change in the Green primary vote had no correlation with how they performed at the previous federal election:

Palmer’s UAP
In general, Palmer’s UAP performed best in western Melbourne, often in seats where Labor tends to win by large margins:
Unlike the primary votes of the other parties analysed here, there was fairly little change in the UAP vote across most electorates. The few exceptions are concentrated in outer eastern and southwest Melbourne, where the UAP gained swings to it in places like Greenvale, Narre Warren, Kalkallo and Pakenham. However, despite these gains, Palmer’s UAP remains stuck in the single digits across the state, which could win it a few seats in a proportionally-represented upper house but isn’t enough for it to make it into the final two anywhere, let alone win a lower-house seat. For the latter to happen, the party would need to massively outperform its federal performance as well as improve preference flows from voters for other minor parties.
The UAP’s improved showing across western Melbourne resulted in the UAP vote being positively correlated with Labor’s:

This is quite unusual – normally, you’d expect a slight negative correlation between the vote for any two parties (since a ‘1’ vote for party A means one less vote for party B), and it speaks to how Palmer’s UAP performed among traditional Labor voters at the federal election.
Independents throughout the State
For the purposes of this analysis, I’ve confined myself to looking at state electorates whose voters were:
- Part of a federal electorate where an independent won over 10% of the first preference vote – for Victoria that would be Goldstein, Indi, Kooyong, Mallee, Monash, Nicholls, and Wannon.
- At least 80% of the voters in that state electorate are from one federal electorate – e.g. the district of Narracan, where an estimated 86% of its voters voted in the Division of Monash at the federal level.
Applying these criteria leaves us with the following electorates:
(if you’re on a mobile device, scroll right for full data or turn your device landscape)
| State district | Held by: | Overlapping federal division | Independent | IND % primary in district | IND % primary in federal electorate |
|---|---|---|---|---|---|
| Benambra | LIB (2.6% vs IND) | Indi | Helen Haines | 40.7% | 40.7% |
| Hawthorn | ALP (0.6% vs LIB) | Kooyong (99%) | Monique Ryan | 41.5% | 40.3% |
| Kew | LIB (4.7% vs ALP) | Kooyong (98%) | Monique Ryan | 38.5% | 40.3% |
| Mildura | IND | Mallee | Sophie Baldwin | 11.3% | 10.0% |
| Narracan | LIB (10% vs ALP) | Monash (86%) | Deb Leonard | 8.0% | 10.7% |
| Shepparton | IND (5.3% vs LIB) | Nicholls (99%) | Rob Priestly | 32.4% | 25.5% |
| South-West Coast | LIB (3.2% vs ALP) | Wannon | Alex Dyson | 26.0% | 19.3% |
Of the seven state electorates which fit the above criteria, two are already held by independents at the state level, with another nearly falling to an independent at the last state election. Of the other four, two (Hawthorn and Kew) look like they could be won by the right independent with the right campaign, while Narracan seems less receptive to an independent – even accounting for the fact that 14% of the electorate did not get to vote for Deb Leonard.
The South-West Coast also looks reasonably friendly towards independent candidates; at the federal level, independent Alex Dyson likely won the two-candidate-preferred in the areas covered by South-West Coast. At the last state election, independent James Purcell (who’s running again this time) came within 10% of making it to the final two in South-West Coast. As Dyson made a 9.6% improvement on his primary vote between the 2019 and 2022 federal elections in Wannon, it’s plausible that this district might be won by an independent if the increase in votes for independent candidates is replicated at the state election.
The two-party-preferred across Victoria
The patterns of the primary vote are fairly similar when it comes to the two-party-preferred (2pp) vote across the state. If you need a reminder on what the two-party vote is, check out the explainer below:
Because Labor and Coalition parties tend to have the largest vote shares at Australian elections, in most electorates the race comes down to a Labor-vs-Coalition contest (as parties/candidates with smaller shares of the vote get sequentially eliminated).
In these electorates, it’s easy to figure out what share of the population prefers Labor over the Coalition or vice versa, using the two-candidate-preferred (2cp) figure produced through the instant-runoff system.
However, in some electorates, the final two candidates may not consist of a Labor and a Coalition candidate. Candidates from one of the smaller parties (e.g. Greens, One Nation, Katter’s Australian, Centre Alliance) may receive more votes (or more preferences) than one or both major parties.
Additionally, there are instances when the final-two pairing ends up being one Coalition candidate against another.
When the final-two pairing is not a Labor versus Coalition contest, this is known as a non-classic contest.
For all non-classic electorates, the Australian Electoral Commission (AEC) will go back through the ballots, and do a count of how many voters placed the Labor candidate over the Coalition candidate(s), or vice versa.
This allows the AEC to determine what share of voters ‘prefer’ Labor over the Coalition in every electorate. This proportion is known as the two-party-preferred or 2pp for short.
The AEC also calculates statistics such as how many voters for each party placed the Coalition over Labor or vice versa, allowing the determination of two-party preference flows. For example, 82.21% of Greens voters placed Labor over the Coalition at the 2019 federal election.
Two-party-preferred can be quite a useful statistic both at the seat level and nationally. For example, if you live in a non-classic seat with an Independent MP, and said Independent MP is retiring at the next election, you might be interested to know if your seat is more likely to fall to Labor or to the Coalition. In the event of a hung parliament, minor-party and independent MPs may be interested to know if their seat’s voters would prefer that they support a Labor or Coalition government.
Two-party-preferred also helps make sense of changes in primary vote share. If I came up to you and told you that Labor’s primary vote has declined by 3 points, with the Coalition gaining one point, the Greens gaining one point and other minor parties collectively gaining one point, it’s not immediately apparent what that means for most seats (which are Labor-vs-Coalition contests).
On the other hand, if I told you that there’s a two-party-preferred swing of 1.7% against Labor, you can look up the two-party-preferred of all electorates at the last election and get some idea of which seats might fall.
Note that two-candidate-preferred and two-party-preferred are not the same thing. While they can be the same if the final two candidates are Labor and a Coalition candidate, two-candidate-preferred specifically refers to the final vote shares between the final two candidates in an electorate, while two-party-preferred refers to the proportion of voters in that electorate who prefer Labor over the Coalition or vice versa.
Labor’s two-party vote is strongest in western Melbourne, while the Coalition is strongest in the regions, with some conservative-leaning areas in eastern Melbourne. The two-party vote more clearly shows how once-safe Liberal seats in eastern Melbourne have become somewhat marginal – electorates like Rowville are coloured in purple on this map.
Switching over to the two-party swing feature, you can see the wall of solid blue representing swings against Labor in outer western Melbourne, while a chunk of red represent the swings against the Liberals in inner and eastern Melbourne. Not many other electorates saw large swings either way, with most of the large swings outside Melbourne likely being attributable to candidate effects.
For example, there were large two-party swings to Labor in Ovens Valley and Benambra while Mildura and Morwell saw large two-party swings to the Nationals at the 2022 federal election. Ovens Valley and Benambra are largely comprised of voters from the federal division of Indi, where independent Helen Haines made large gains against the Coalition candidates. The other major component of Ovens Valley was the Division of Nicholls, where independent Rob Priestly achieved large swings against the new Nationals candidate. On the other hand, Mildura and Morwell are part of Mallee and Gippsland, whose Nationals MPs massively outperformed their party vote (as measured by comparing the House and Senate vote for the National Party – more in-depth discussion for another time).
Interestingly, unlike the votes-vs-swing plots for the Labor and Coalition primary votes, the correlation between the 2019 two-party vote in each state district and the 2022 two-party swing is weaker:

This is most likely due to the combination of different types of electorates which were strongly Labor- or Coalition-leaning on a two-party basis at the 2019 federal election. e.g. inner-city Melbourne and outer-western Calwell were both strongly Labor-leaning on a two-party basis. However, Melbourne, like other inner-city electorates, swung to Labor on a two-party basis (by 10.1%) while Calwell swung against Labor like other outer-west Melbourne electorates (by 7.2%).
While the primary votes-vs-swings plot suggested a picture of depolarization, the two-party vote-vs-swing suggests a combination of erosion and reinforcement – some former strongholds are being reclaimed by the electoral tides of realignment, but others are building up sandbanks against change (or being held down by strong candidates (again, more on that later). Zooming out from the two-party vote, the swings from the federal election suggest that Northcote, Hawthorn, Kew and South-West Coast are the most likely to fall to minor parties (GRN – Northcote) or independents, with the potential for more Green gains across inner Melbourne with the aid of Liberal voters’ preferences.