A collection of details from the final forecast and random findings, each too small for a separate piece.
Normally, we’d have an Upside/Downside piece, but Rebekah’s run into some technical difficulties – turns out multiverse travel isn’t as easy as the Marvel Cinematic Universe makes it look.
I think the broad picture will be familiar to any poll/forecast-watchers, however – polling and other predictors suggest that Labor is a little more likely than not to win a majority, but a hung parliament is plausible and a Coalition majority is possible but not very likely. If the polls are off by the same margin as in 2019 in the Coalition’s favour, we’d be looking at a 2019-style result with either side plausibly forming government on negotiations with the crossbench; if there’s a polling error favouring Labor, we’d be looking at a clear Labor majority and the possibility of a blue-blood-bath across the Coalition half of the pendulum. The Greens have a decent shot at gaining an extra seat in the House, while it looks like the crossbench will likely expand.
How will the popular vote convert into seats for each party?
One interesting thing is the votes-to-seats relationship. This tends to favour governments due to the fact that governments typically have more incumbents to “hold down the fort” in marginal electorates with personal votes; in addition the pre-election pendulum for this election slightly favours the Coalition due to the pattern of swing last time.
Plotting the Coalition’s seat margin (how many more seats the Coalition gets over Labor) against the Coalition’s two-party-preferred in simulations from our forecast, you can see how the cloud of simulations is positioned very slightly upwards of the horizontal line:
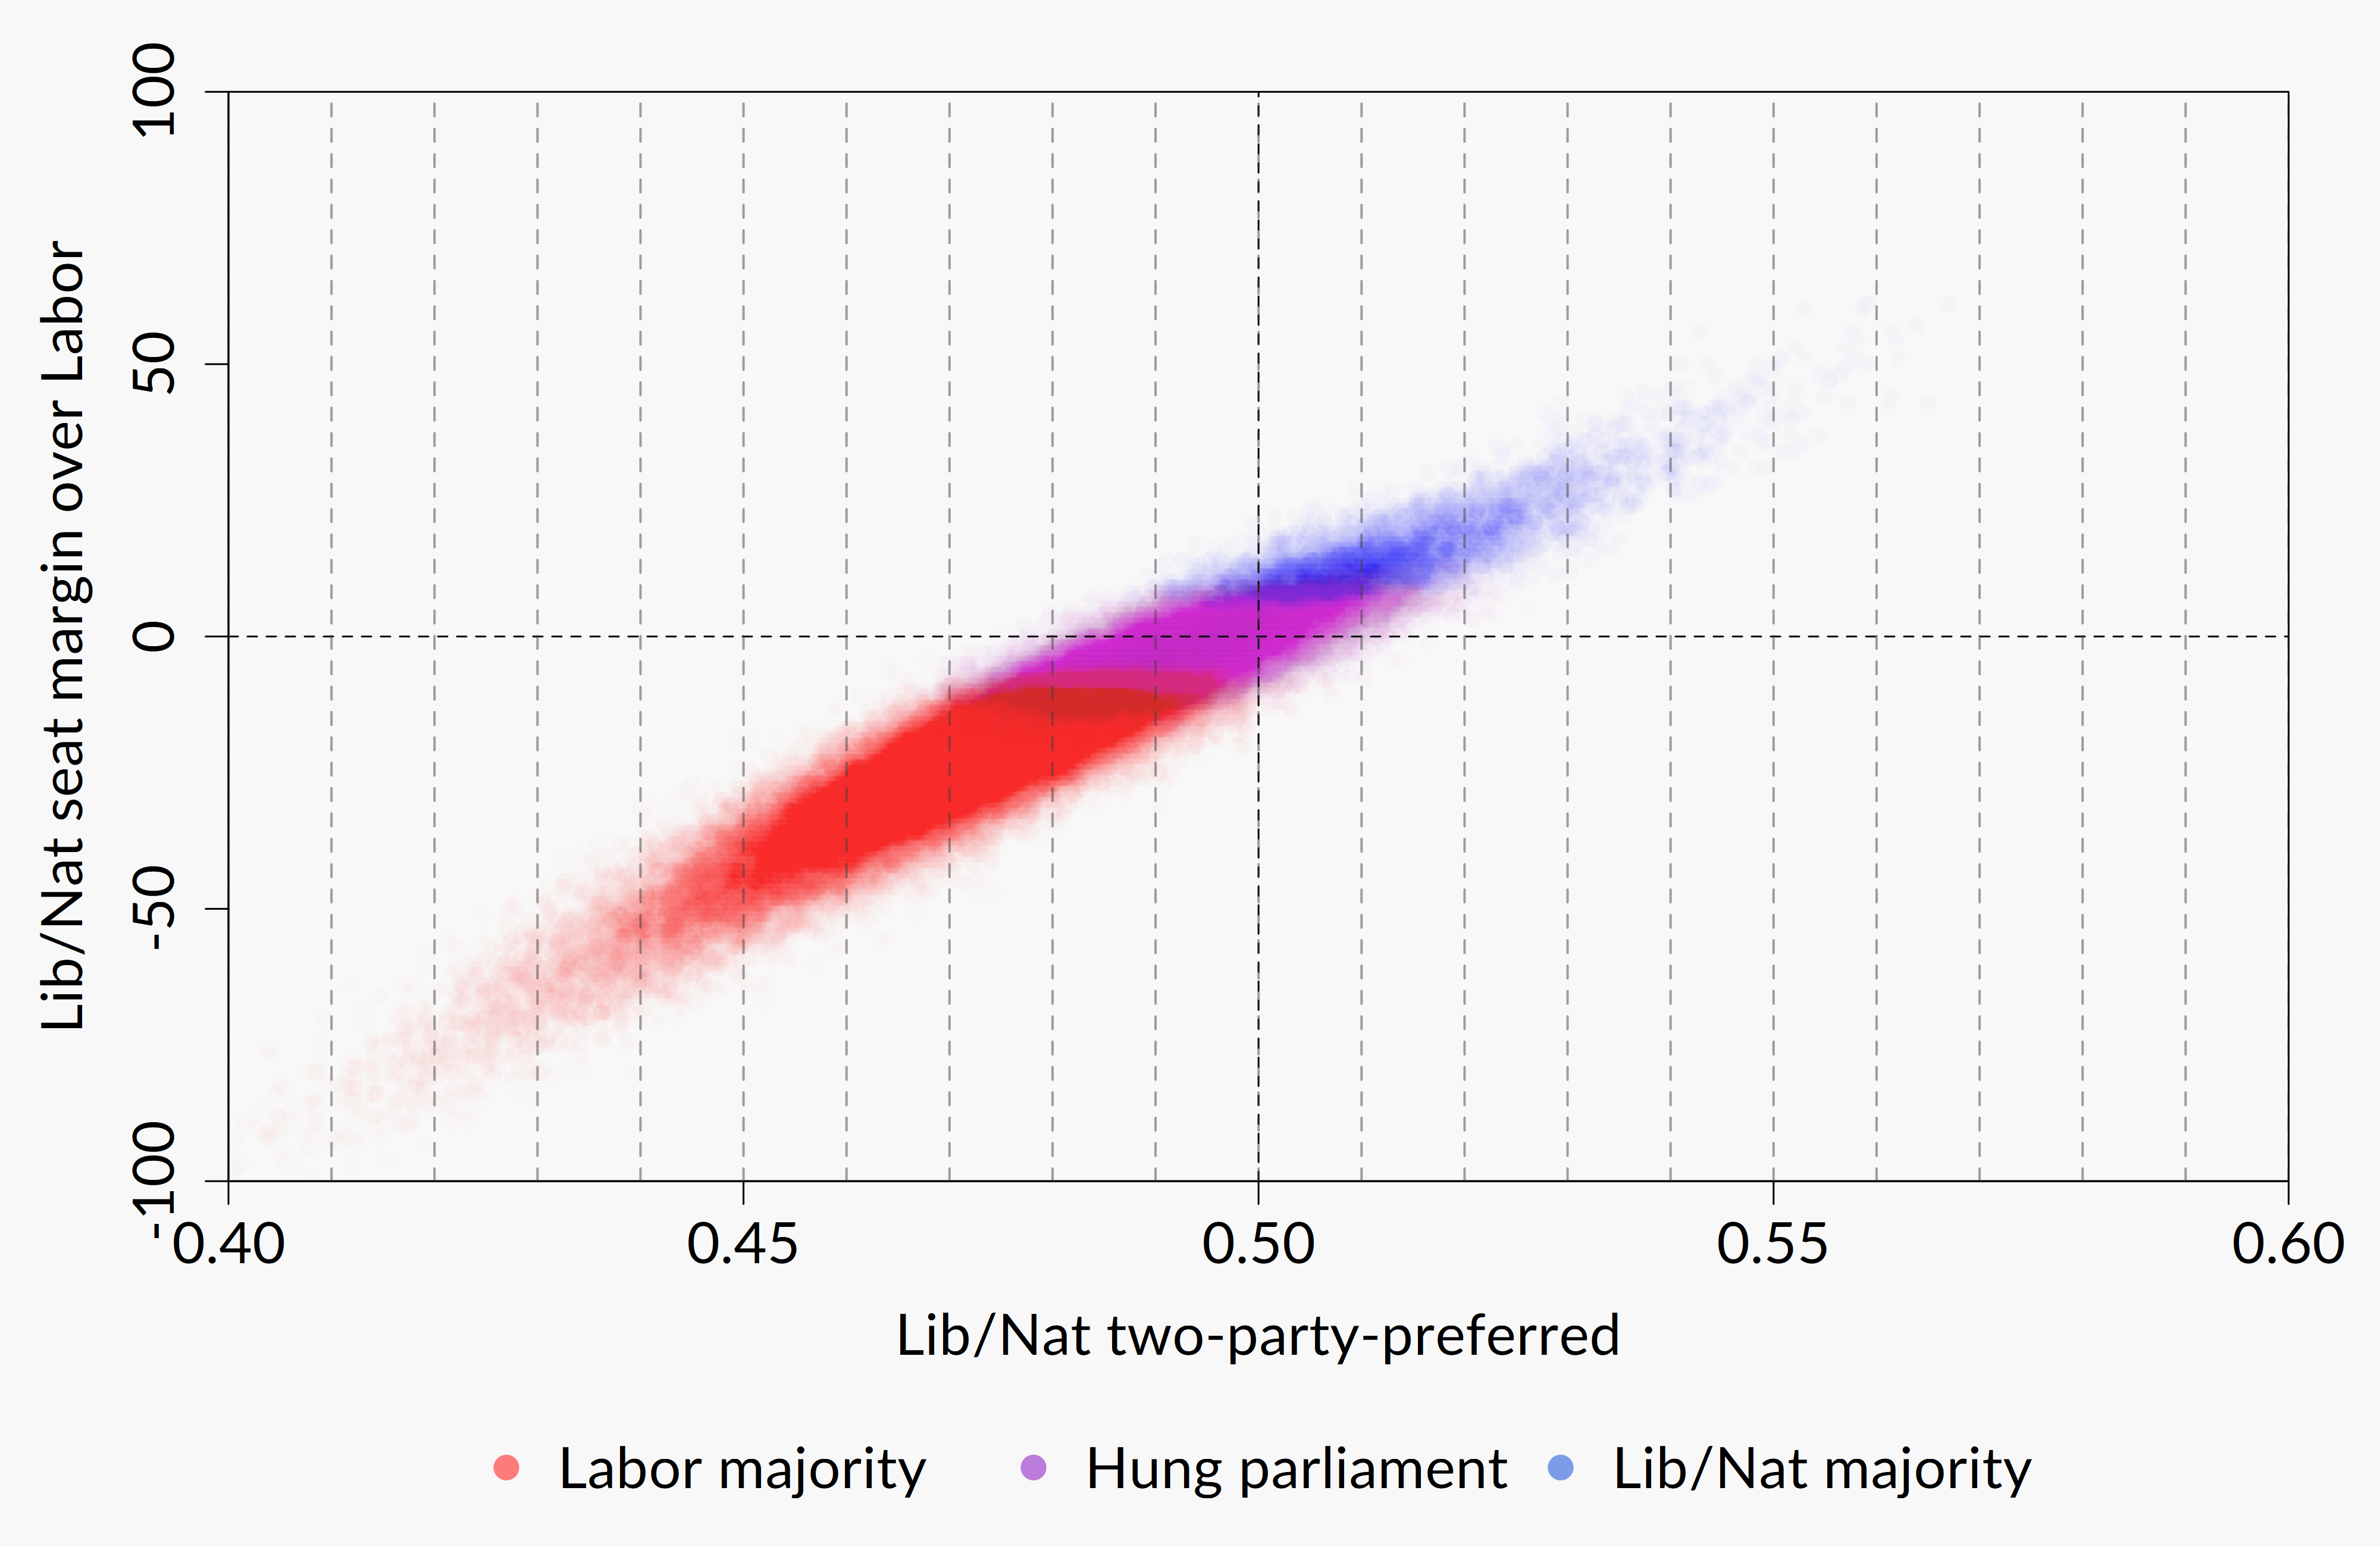
In general, if there is to be a popular vote/seats split, it’s more likely to favour the Coalition than Labor. However there is a small chance that it could work the other way if the Coalition fails to defend its safe seats from independent challengers, or if it makes gains in safe Labor electorates without managing to actually win them. My model estimates the probability of Labor winning the 2pp but failing to win more seats than the Coalition at about 1-in-20 (5%) while the probability of the Coalition winning the 2pp but failing to hold more seats than Labor at just over 1-in-100 (1%).
One other thing you can see from that graph is how hung parliament becomes less likely as either side begins to extend its 2-party-preferred margin. I’ve plotted the vertical lines at 1% increments of the 2pp for each side – e.g. the first vertical line to the left of 0.5 refers to a L/NC 2pp of 49 (or ALP 51). If Labor wins 53 or more of the 2pp, a hung parliament is very unlikely; ditto if the Coalition wins 52 or more of the 2pp.
Contrary to what some pundits may attempt to play up, if the current polling average (ALP 52.9) is replicated at the polling booths, there isn’t much chance of a hung parliament; most of the probability of a hung parliament in current forecasts comes from the probability that there is some polling error in the Coalition’s favour.
For the minor parties, the relationship between votes and seats is generally weaker than it is for the major parties:
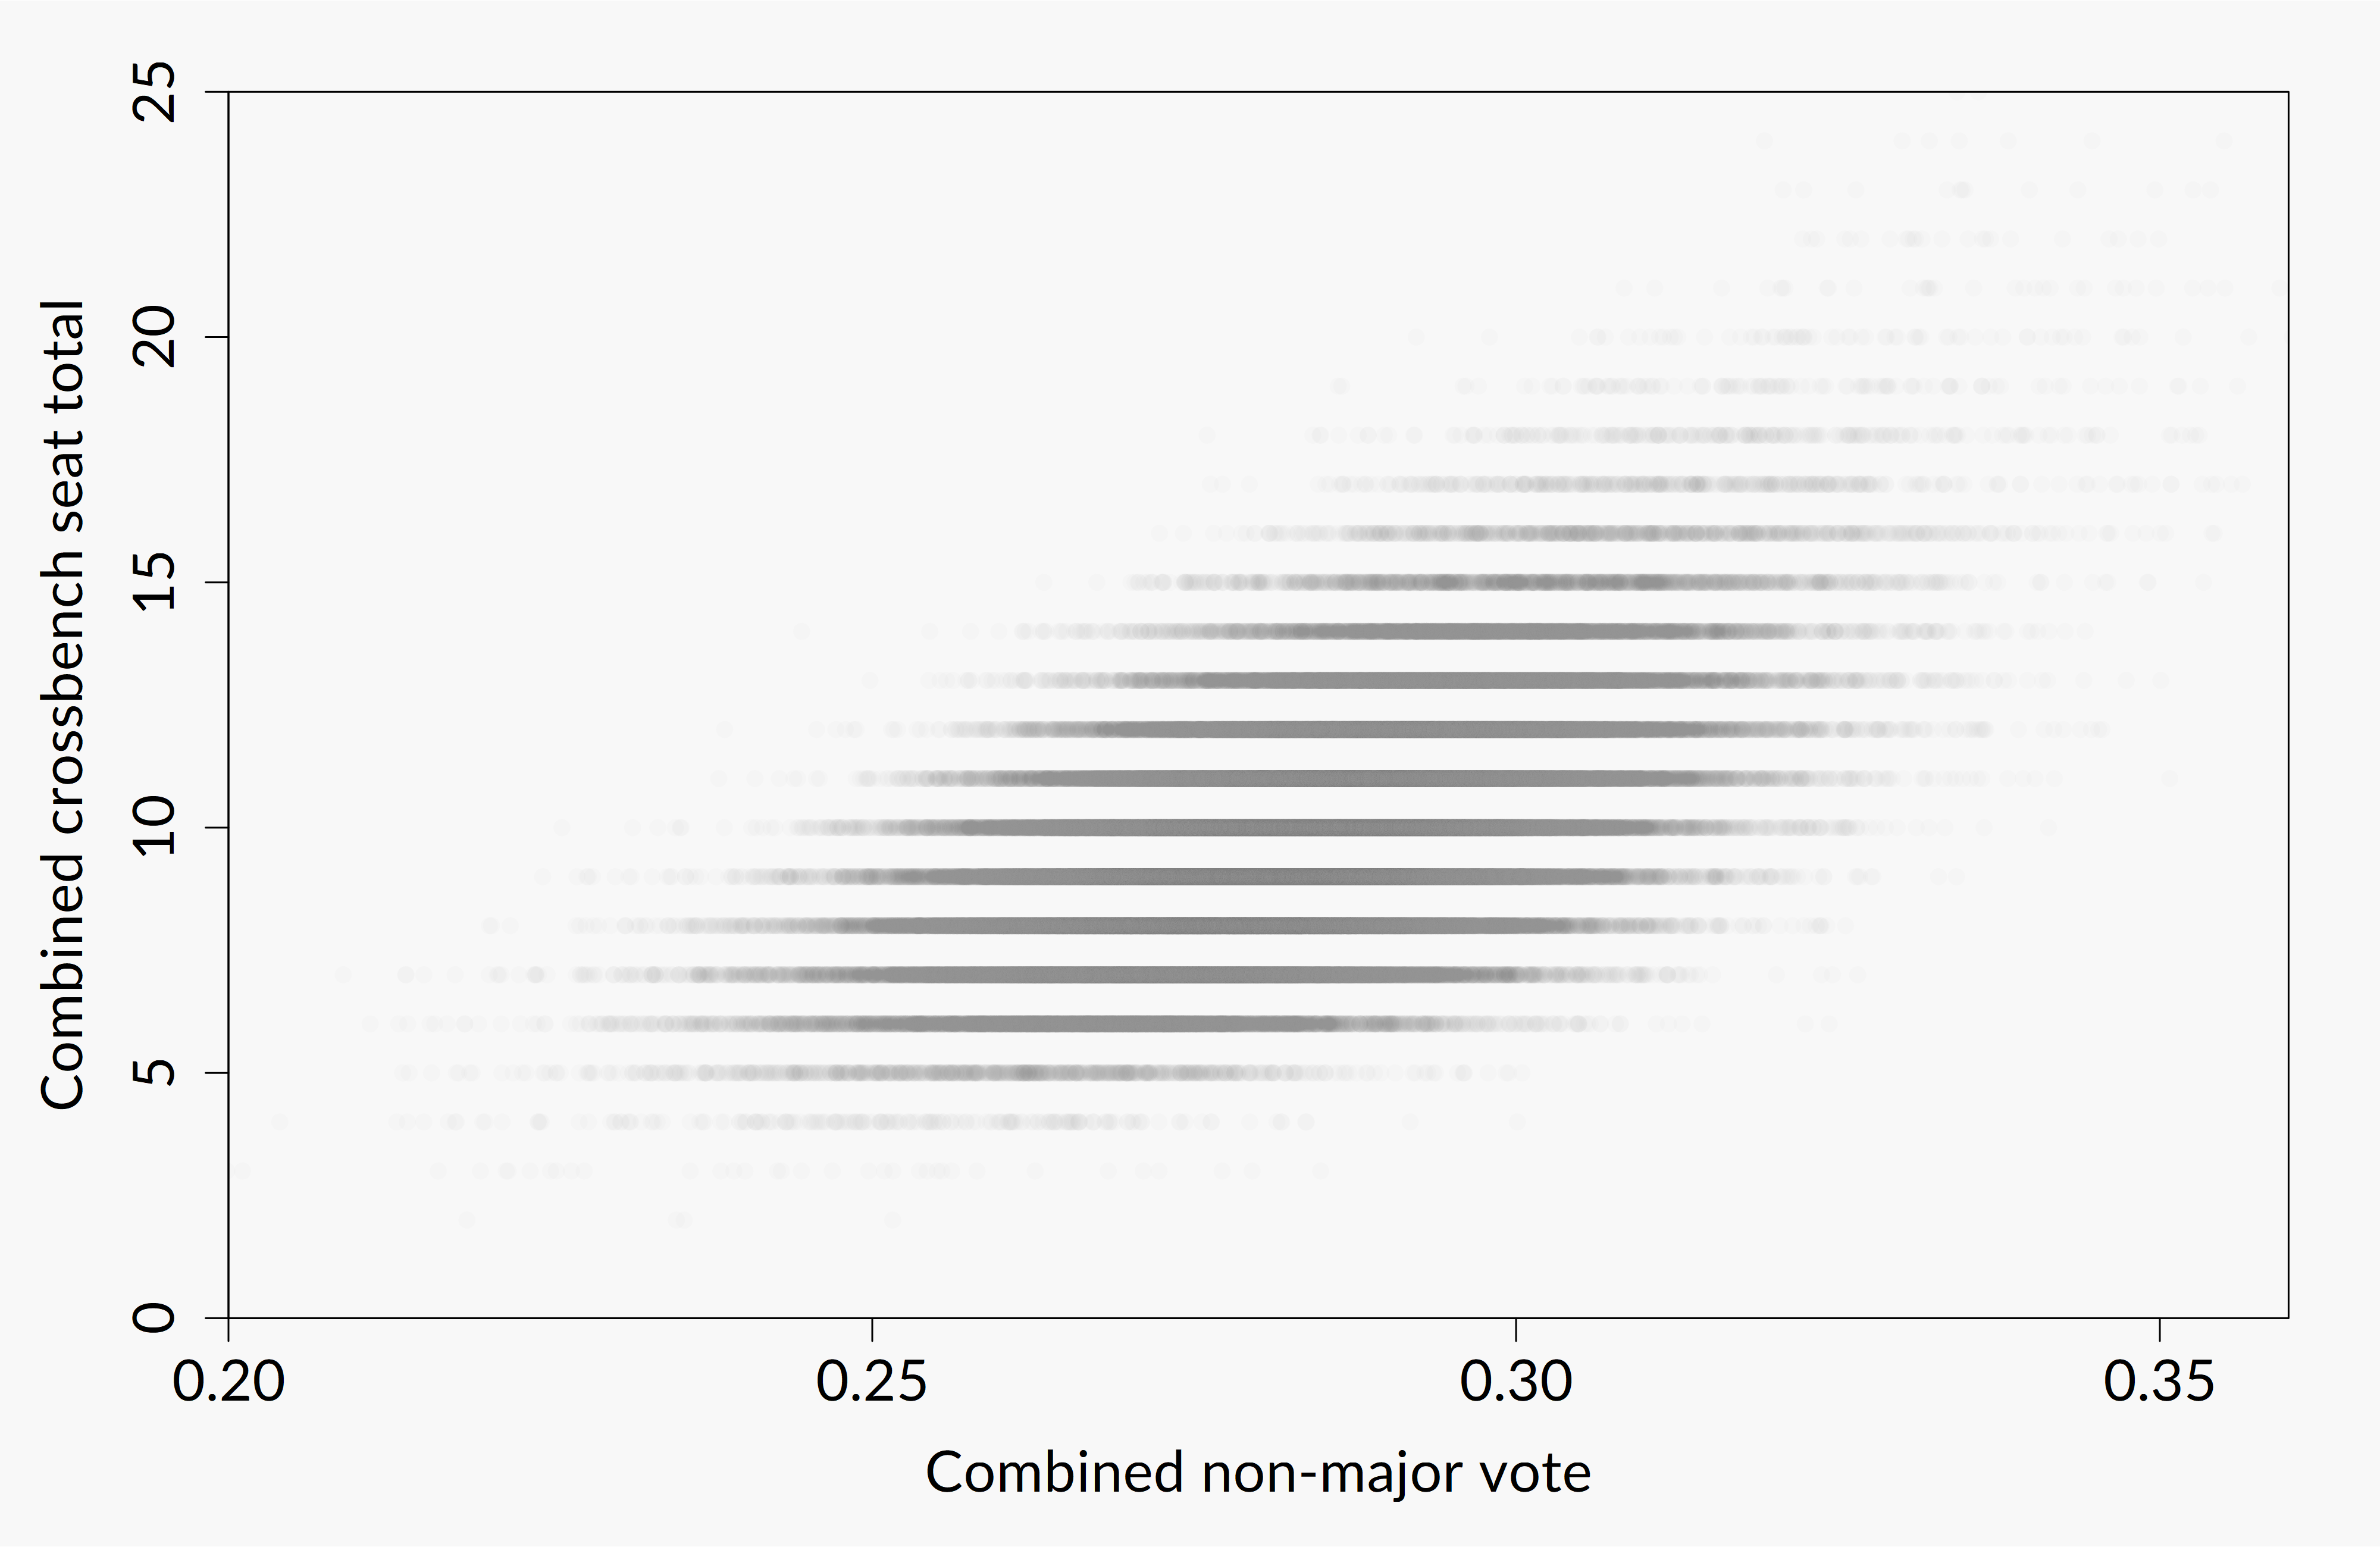
The relationship is roughly linear but the uncertainty increases as you get to the tails. If the major party vote falls apart, it’ll likely translate to some extra seats for the crossbench, but depending on where that extra vote ends up it might only mean a few extra crossbenchers, or it might mean a doubling of the crossbench.
(In stat-speak, the model thinks that there is some heteroscedasticity in the vote/seats relationship)
Which electorates are likely to be Labor’s or the Coalition’s 76th?
These are the electorates which showed up as the Coalition’s or Labor’s 76th seat on a 2pp basis in the simulations from our final forecast. Electorates which were won by a non-major party candidate were excluded from the calculation.
Note that since there are 151 electorates and each electorate only elects one representative (unlike the US electoral college), the probability of any given electorate being the 76th is low. The lists provided below show only the top 10 most likely 76th seat for either side and do not capture a majority of the probability (in other words it’s more likely that the 76th electorate is outside this list than it is on it), however I think it’s a good-enough way to get a feel for the kinds of seats either side needs to be winning for a majority.
First off, the seat that would most likely give the Coalition a majority:
| Division | Probability of being 76th L/NC seat | Current L/NC 2pp |
|---|---|---|
| Gilmore | 3.4% | 47.4% |
| Corangamite | 3.3% | 49.0% |
| Macquarie | 3.3% | 49.8% |
| Dobell | 3.2% | 48.5% |
| Dunkley | 3% | 47.3% |
| Swan | 2.9% | 53.2% |
| Eden-Monaro | 2.8% | 49.2% |
| Greenway | 2.8% | 47.2% |
| Boothby | 2.7% | 51.4% |
| Reid | 2.6% | 53.2% |
And Labor’s most likely seat which would give it a majority:
| Division | Probability of being 76th ALP seat | Current ALP 2pp |
|---|---|---|
| Chisholm | 3.2% | 49.5% |
| Robertson | 3.1% | 45.8% |
| Lindsay | 3.0% | 45.0% |
| Reid | 3.0% | 46.8% |
| Pearce | 3.0% | 44.8% |
| Longman | 2.8% | 46.7% |
| Banks | 2.7% | 43.7% |
| Corangamite | 2.7% | 51.0% |
| Gilmore | 2.6% | 52.6% |
| Casey | 2.6% | 45.4% |
The first thing to note is that both sides will likely need to gain seats off each other for a majority. This makes intuitive sense for Labor – obviously the opposition needs to gain seats to win office – but why is this the case for the governing Liberal/National Coalition?
The reason boils down to the probability that the Coalition loses two or three seats to the crossbench, due to credible challenges in electorates like Kooyong, Goldstein and others. As it starts out with 76 (assuming it regains Hughes), the Coalition would need to go hunting in Labor-held marginals for a majority, unless it is certain of fending off crossbench challengers.
How might each state shift alongside the nation?
Note that the figures cited below are averages (specifically, means); there is some uncertainty attached to each estimate. This uncertainty is higher for QLD/WA/SA/TAS/ACT/NT than it is for NSW/VIC due to historical accuracy, sample sizes and availability of data in each jurisdiction.
On a two-party basis:
- NSW is expected to swing to the left by a little less than the rest of the nation; state breakdowns have historically been fairly accurate in NSW with an average error of +/- 1.7% and very little overall skew either way (average +0.1%) and hence are weighted at nearly 50/50 with the expected swing from national polling.
- Victoria looks like it will be swinging to Labor but by about 2% less than the rest of the nation, suggesting a slight reversion to the mean after Labor gained there in 2019. State breakdowns have historically been about as accurate in VIC as they have in NSW with an average error of +/- 1.5% and minimal skew either way; hence they’re weighted at a little over 50/50 with the expected swing from national polling. The reason for the different weighting is that NSW has tended to hew a lot closer to the national swing than VIC and hence imputing the swing from national polling is given more weight in NSW.
- Queensland is the one state in which the federal pollsters disagree, with Newspoll suggesting a swing to Labor slightly smaller than the rest of the nation while Resolve and others suggesting a record swing to Labor. Historically, however, QLD state breakdowns in federal polls have been disastrous on a 2pp basis, with a 3.5% average absolute error (for context the 2019 error was 3%) and a tendency to skew to Labor by 1.5% on average.
Hence, our model doesn’t pay a lot of attention to Queensland state breakdowns, preferring to impute the swing there from nationwide polling. On that basis, the model thinks a swing like that suggested in Newspoll is more likely, expecting a swing in QLD either on par with the rest of the nation or slightly smaller. - Western Australia‘s annihilation of its state Liberal party has led many to predict that Labor might win the 2-party vote in that state for the first time since Bob Hawke. This is backed up by polling which suggests that the swing to Labor in WA might be 3% or more higher than the swing to Labor in the rest of the nation (if such a swing materialises).
Our model takes a slightly more conservative view of voting intention in WA. State breakdowns in WA have had a higher average error than NSW/VIC (+/- 2%) but one which is acceptable in my view given the smaller sample sizes typical of WA state samples. They also slightly skew to Labor by about 1% on average, which is something the model partly adjusts for but isn’t of too much concern given this calculation is off just 7 data-points (federal elections, 2001 – 2019).
It is however difficult to impute the swing in WA from national results (see the 2007 federal election for an example of this) and hence the model tends to defer a bit more to the WA state breakdowns than it would if that error rate was seen on a different state. On that basis, it thinks that there is a nearly 50% chance of Labor winning the two-party vote in WA, though the uncertainty is fairly high on that prediction. - South Australia is expected to swing to Labor at roughly the same rate as the rest of the nation. The final Newspoll breakdowns we have suggested a bigger swing, but imputing the swing in SA from nationwide polling has a fairly low error rate and hence the model has gone a little more with that. State breakdowns in SA do well given their small sample size (average error +/- 1.9%) and errors don’t tend to favour either side of politics (average skew 0.2% to Labor, again note this is seven elections and hence not statistically-significant in any way).
We don’t have breakdowns from Tasmania, the ACT or the NT; however on the basis of the MRP model and past voting history, our forecast expects a smaller-than-nationwide swing to Labor in Tassie and NT and the ACT to move roughly in-line with the nation.
The root causes of these swing deviations in Tassie and the NT are both personal vote effects. In Tasmania, the Liberals have two new incumbents in Bass and Braddon who are expected to bring in some personal votes, while they are also expected to do better than uniform swing in Lyons due to their new candidate not being disendorsed. In the Northern Territory, the retirement of Labor’s Warren Snowdon from Lingiari is expected to result in Labor underperforming uniform swing in that electorate, which comprises roughly half the NT’s population.
Other polling miscellany:
- While many Greens target seats are located in Victoria and Queensland, polling suggests that the Greens vote has increased in NSW as well. Polling suggests that the Greens primary in NSW tends to lag the rest of the nation by about a point, which if applied to current polling would see the Greens hit 10%, achieving their best result in that state since 2010.
- Polls also suggest that the UAP is poised to do best in Victoria, doing about 1% better in that state than the rest of the nation. However there isn’t a ton of data on pollster accuracy regarding the UAP, and in the one or two elections we have, the pollsters actually over-estimated UAP/PUP voting intention, so there is quite a bit of uncertainty.
- One Nation is expected to improve its vote the most in NSW and the NT; however this is more due to One Nation actually running in all electorates in those jurisdictions (or running at all, in the case of the NT) rather than any actual shift towards One Nation in voting intention terms. It’s also expected to either hold or decline in Queensland and Western Australia, where it did run in all electorates last time.
- Publishing undecideds was not very common at the last election, but the data I could find suggests that the undecided rate in final polling is either on par with 2019 or slightly lower. Newspoll and Ipsos report an Undecided of 5% this time while Essential and Morgan are at 6%; in comparison the final YouGov/Galaxy poll from last election published an undecided rate of about 7%. Data on historical Undecided rates is very difficult to find and hence it’s hard to tell how much this impacts poll accuracy.
How responsible are errors in Queensland for federal polling error?
To analyse this, I grabbed the error on the final adjusted breakdown, State breakdowns adjusted such that the federal 2pp matched the 2pp in the final poll. e.g. if the federal 2pp in the state breakdowns was ALP 51, but the 2pp in the final poll by that pollster was ALP 52, all state breakdowns were shifted towards the ALP by 1%.
I have found that this makes state breakdowns more accurate and hence adopted it in any analysis of state breakdown data. and on the assumption that Queensland makes up about 20% of Australia’s voting population (approximately correct, ever since the turn of the century), I subtracted the 20% of the QLD state breakdown error from the final polling error:
| Election | Pollster | 2pp error, QLD adj. | Final poll err. | Adj. poll err. |
|---|---|---|---|---|
| 2001 | Newspoll | -0.4 | 2.1 | 2.2 |
| 2004 | Newspoll | -6.1 | -2.7 | -1.5 |
| 2007 | Newspoll | -0.6 | 0.7 | 0.8 |
| 2007 | Nielsen | -0.6 | -3.4 | -3.5 |
| 2010 | Newspoll | 4.7 | -0.1 | -1 |
| 2010 | Essential | -2.1 | -1.5 | -1.1 |
| 2010 | Nielsen | -4.1 | -1.9 | -1.1 |
| 2013 | Newspoll | 3 | 0.5 | -0.1 |
| 2013 | Nielsen | 2 | 0.5 | 0.1 |
| 2013 | Morgan | -3 | 0 | 0.6 |
| 2016 | Ipsos | 2.9 | -0.4 | -1 |
| 2019 | Newspoll | -7.9 | -3 | -1.4 |
| 2019 | YouGov | -8.4 | -2.5 | -0.8 |
| Average | ± 3.5 | ± 1.5 | ± 1.2 |
This would be a fairly large increase in polling accuracy. Typically one way of assessing how much a particular factor contributes to error is to calculate the difference in the mean-squared error (MSE) – also known as variance – when that factor is removed. Variance has the advantage over average absolute error of being additive; meaning that adding a variable with variance = 1 to another variable with variance = 2 would give you a variable with variance = 3.
On this basis, Queensland accounts for 16% of all federal polling error. If polling errors were uncorrelated between states, we would expect a variable weighted at 20% to account for just 4% of all variance; in reality polling errors are correlated between states and hence it’d be more than 4%. Nevertheless, Queensland does appear to punch above its population-based weight in terms of contributing to polling errors such as in 2004 and 2019; however the data above suggests that most polling errors tend to be fairly correlated throughout the states despite the unusually high average polling error in Queensland.
(One caveat is that we don’t have state breakdowns for all polls; it’s possible that if we had more state breakdowns we would be able to confirm or disconfirm this hypothesis better by calculating the rate of inter-state correlated error and hence being able to estimate how much polling error “should” come from Queensland)
Not long to go now until the polls close, and we find out what Aussies actually think instead of listening to people like me crunching data. Enjoy the night, and please enjoy and respect the democratic process!