Voting Intention In The Final Week
Currently, Labor maintains a lead of about 54% on a 2-party-preferred (2pp) basis against the Coalition. This has gone up and down a little in recent weeks but the overall picture remains the same – Labor’s 2-party lead remains about double what it was in 2019, and a much larger (and less likely) polling error would have to occur for Labor to lose the popular vote. The major party vote is down slightly on last election but not by enough to threaten Labor’s odds of forming government too much (discussed further below), and the government is in a significantly worse polling position than any government to have been re-elected to date.
Has Australian Polling Accuracy Changed Over Time?
Look closer, and you’ll notice the big errors were always there under the hood. It’s just that we never really focused on them.
All of that we covered in our last piece on Australian polling and whether it’s getting worse over time. But what if a polling error were to happen anyway? After all, American pollsters made changes to their methodology after the 2016 error, and ended up under-estimating Trump again anyway. What if something similar were to happen here?
You can have a go at modelling a polling error yourself with our Simulate-It-Yourself tool (remember to set it to “Election result” – doesn’t make much sense to include more polling error on top of your simulated polling error), but let’s go through some commonly-cited scenarios here:
Scenario 1: Trump 2020 error
What if the Trump 2020 error were to repeat itself here? Didn’t that nearly bring Biden to the point of losing?
Well, the first thing to note is that the Trump 2020 error was actually smaller, on a two-party basis, than the 2019 polling error here in Australia. Based on the averages cited in Wikipedia, Trump out-performed polling averages by about 2%, which if replicated here would result in a Labor 52-48 win and a Labor majority more likely than not:
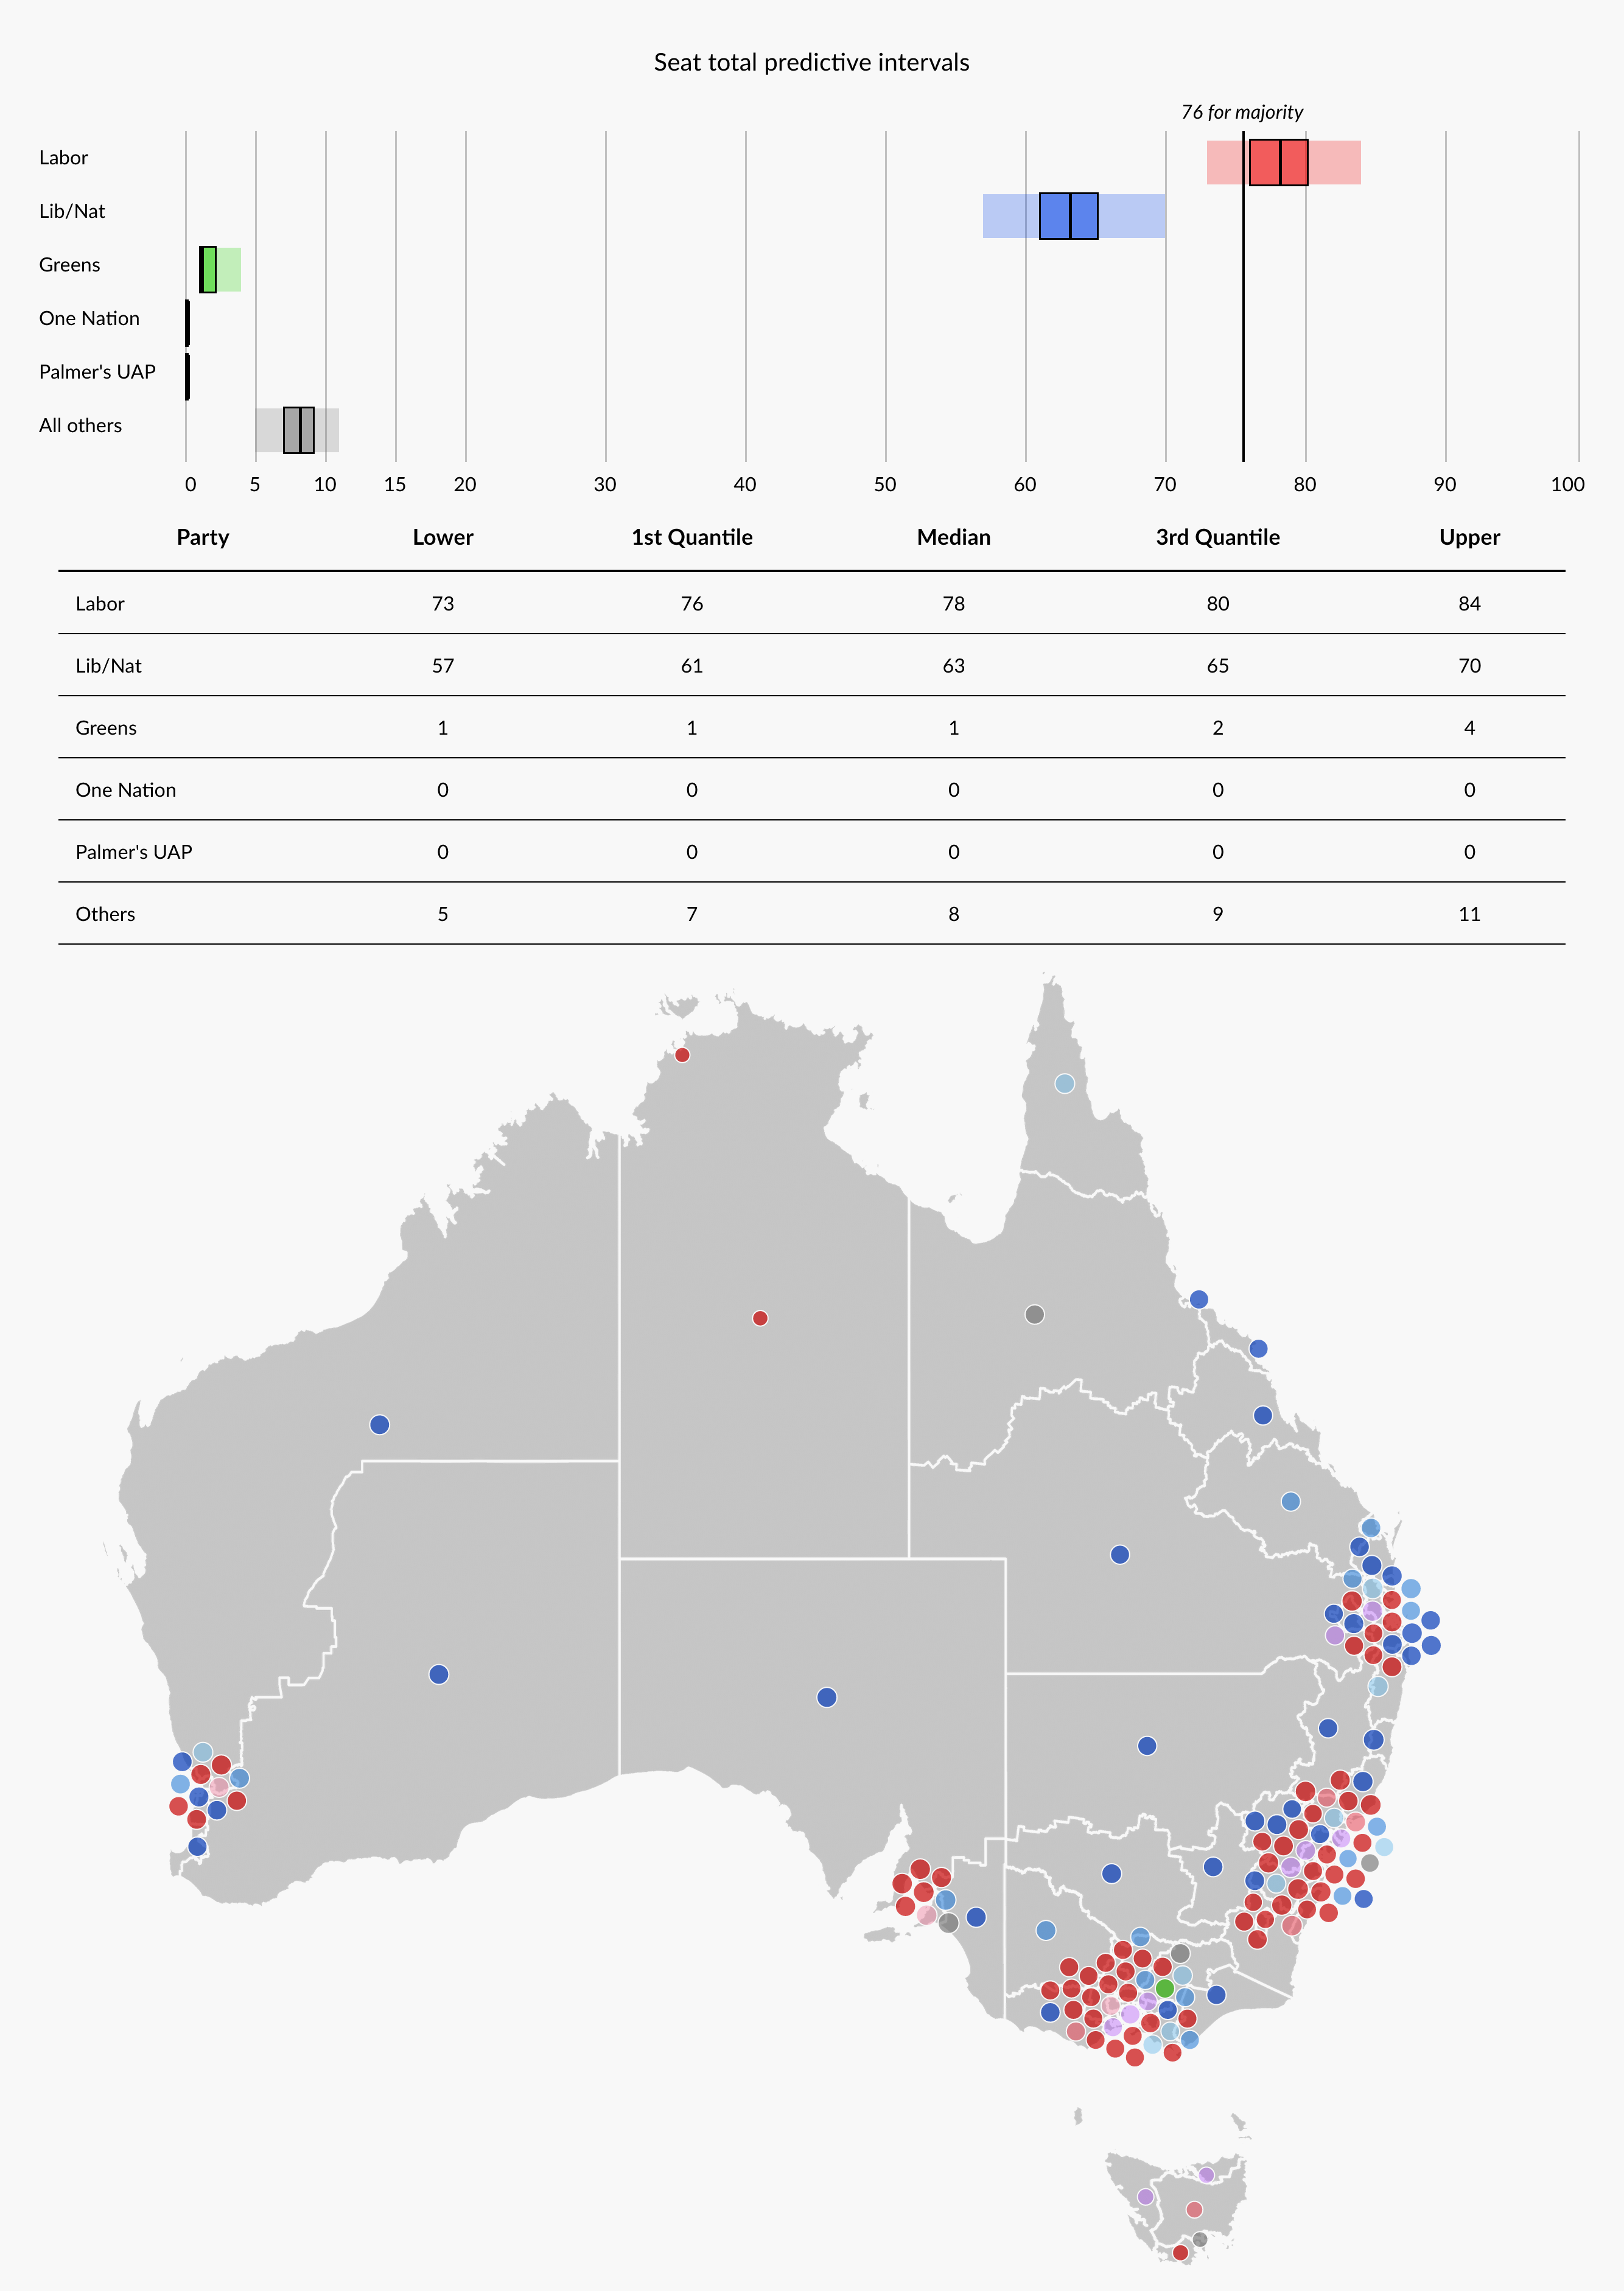
My model above – which is based off the federal election forecast and hence models non-uniform swings, correlated swing etc – suggests that if the election result is 52-48, Labor has roughly a 4-in-5 (81%) chance of a majority. Even if Labor doesn’t win a majority, it would very likely end up with more seats than the Coalition; a hung parliament with no clear winner occurs just once in every 20 simulations (6%). The scenarios where Labor falls short are also likely to be “just short” (ALP 74 or 75), where it would be extremely difficult for the Coalition to form a minority government out of the crossbench.
But that’s a pretty tame polling error. What about the big one? What if Labor under-performs its polling by 3% again?
Scenario 2: Repeat of the 2019 polling error
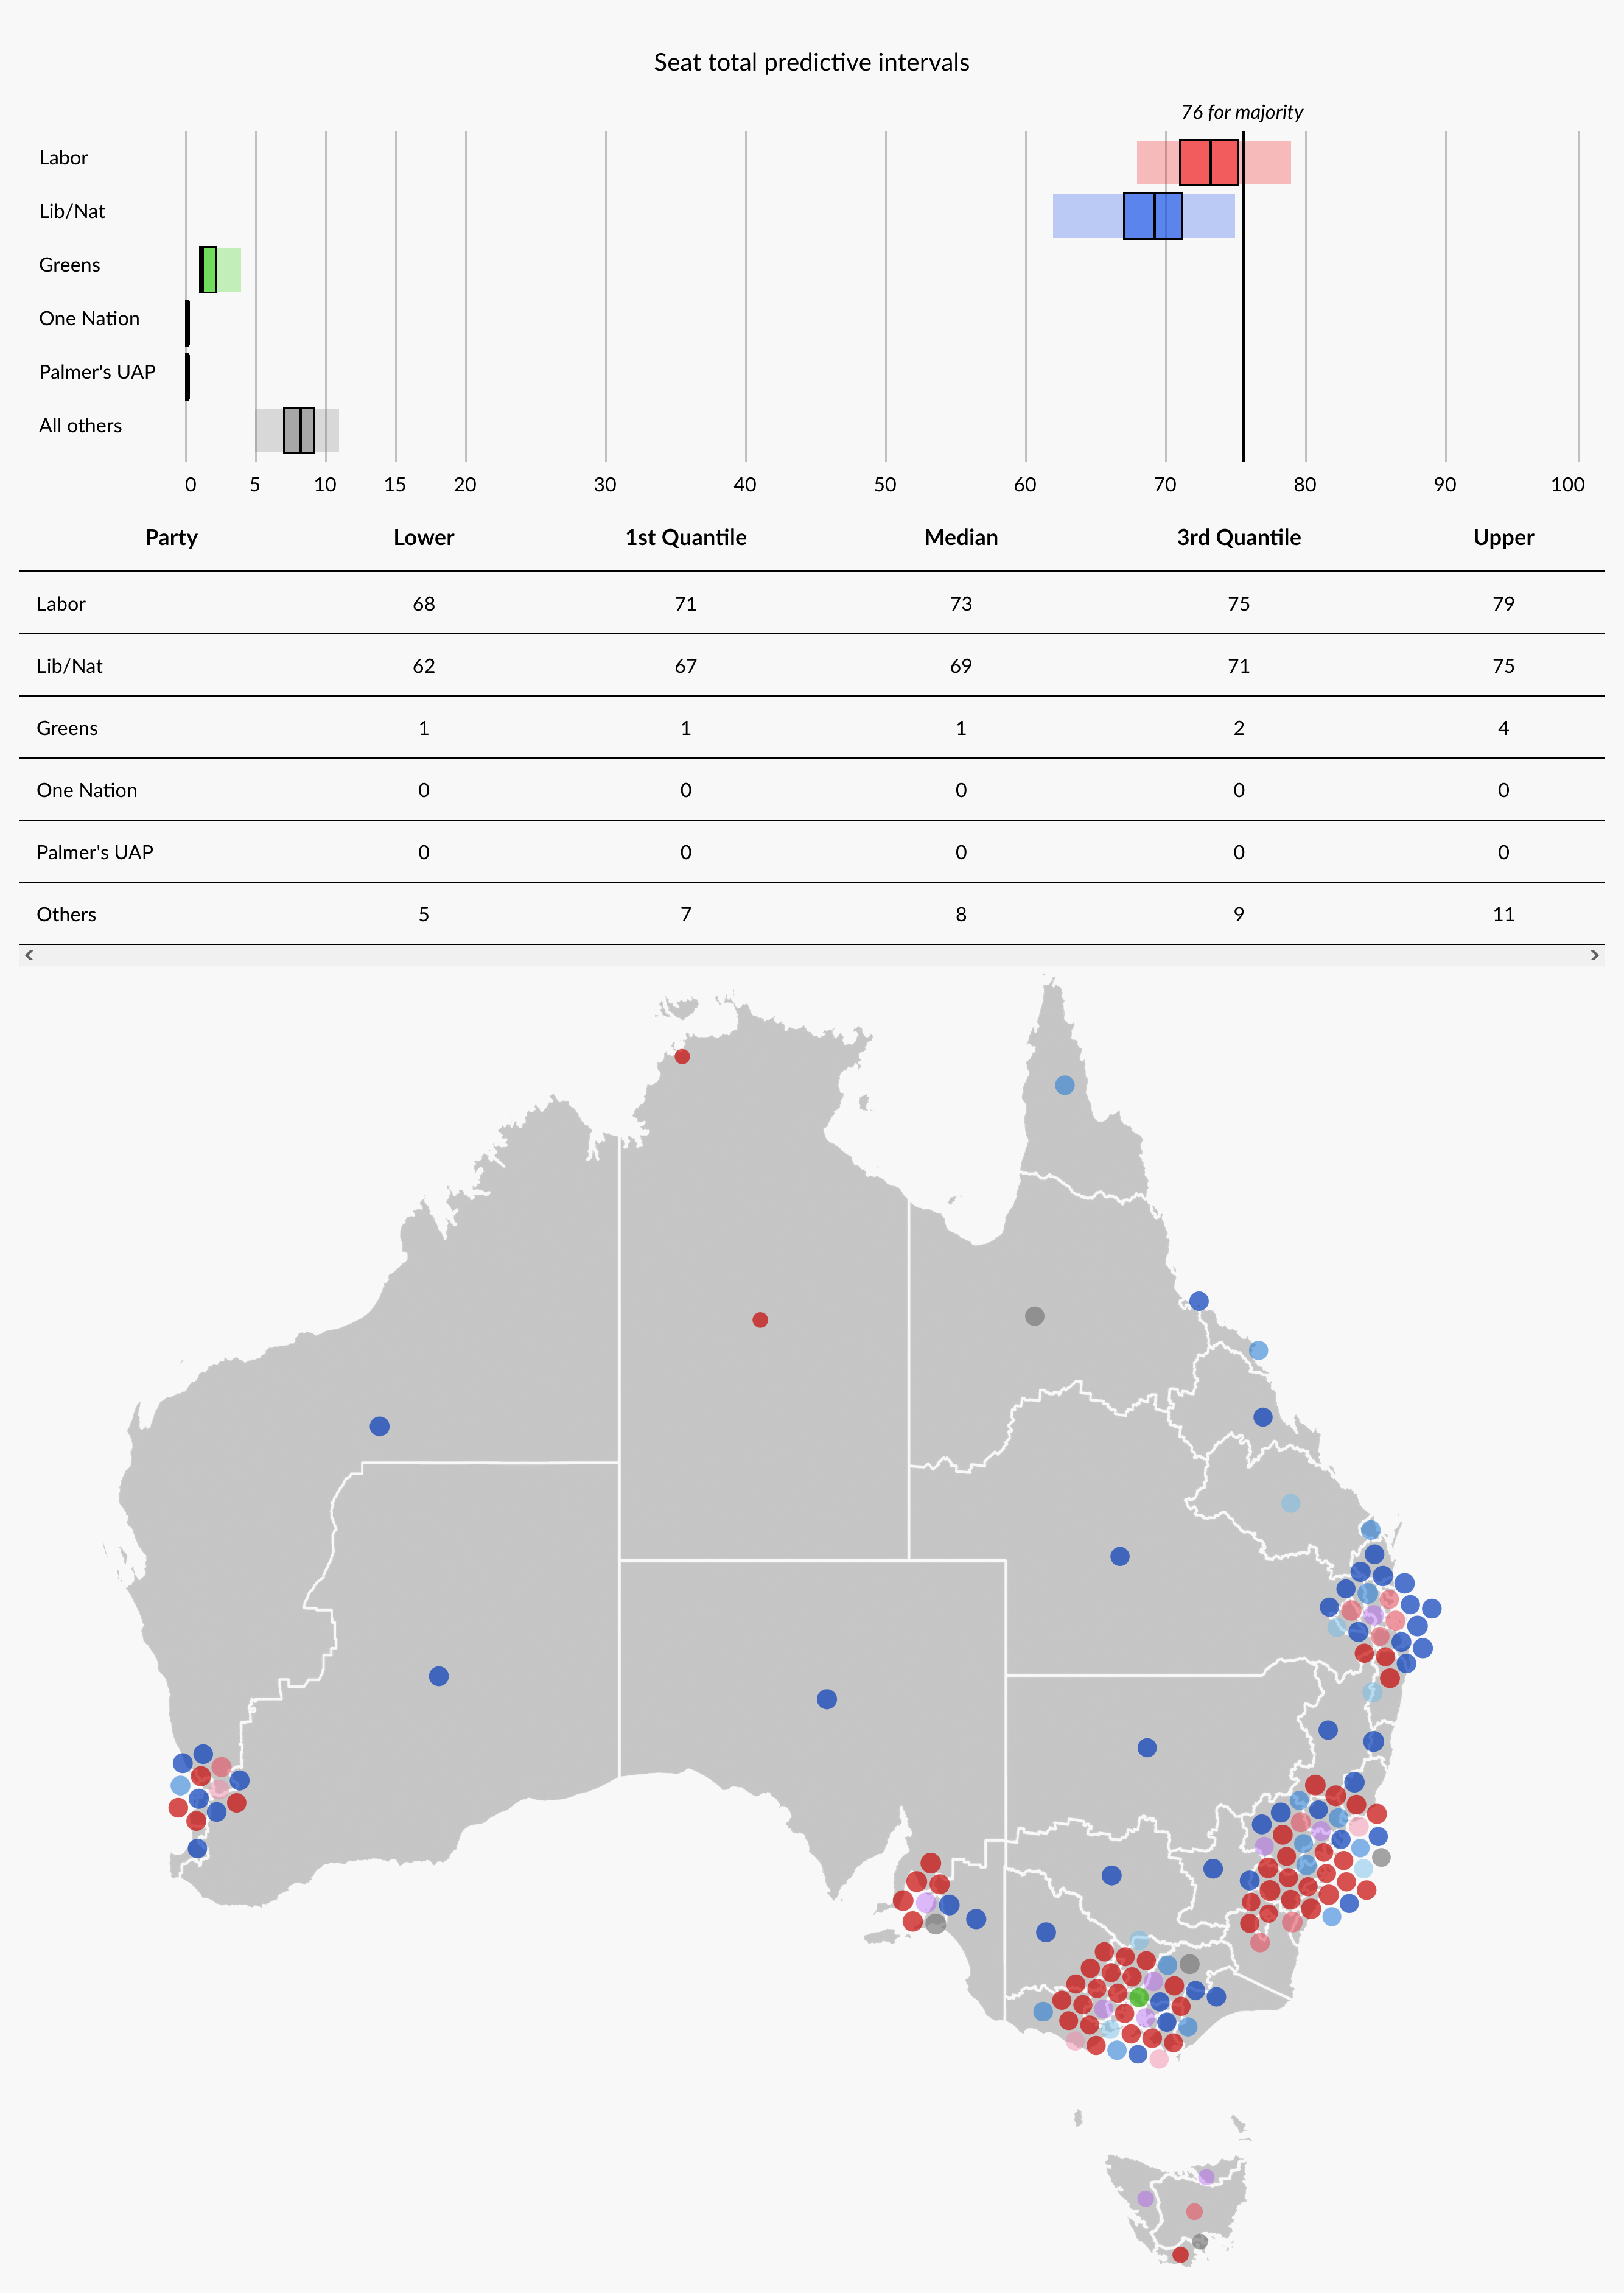
With Labor’s lead in the polls at about 54-46, a repeat of the 2019 error would bring it down to 51-49 – coincidentally about where it was polling just before the 2019 federal election. Our model of the electoral map:
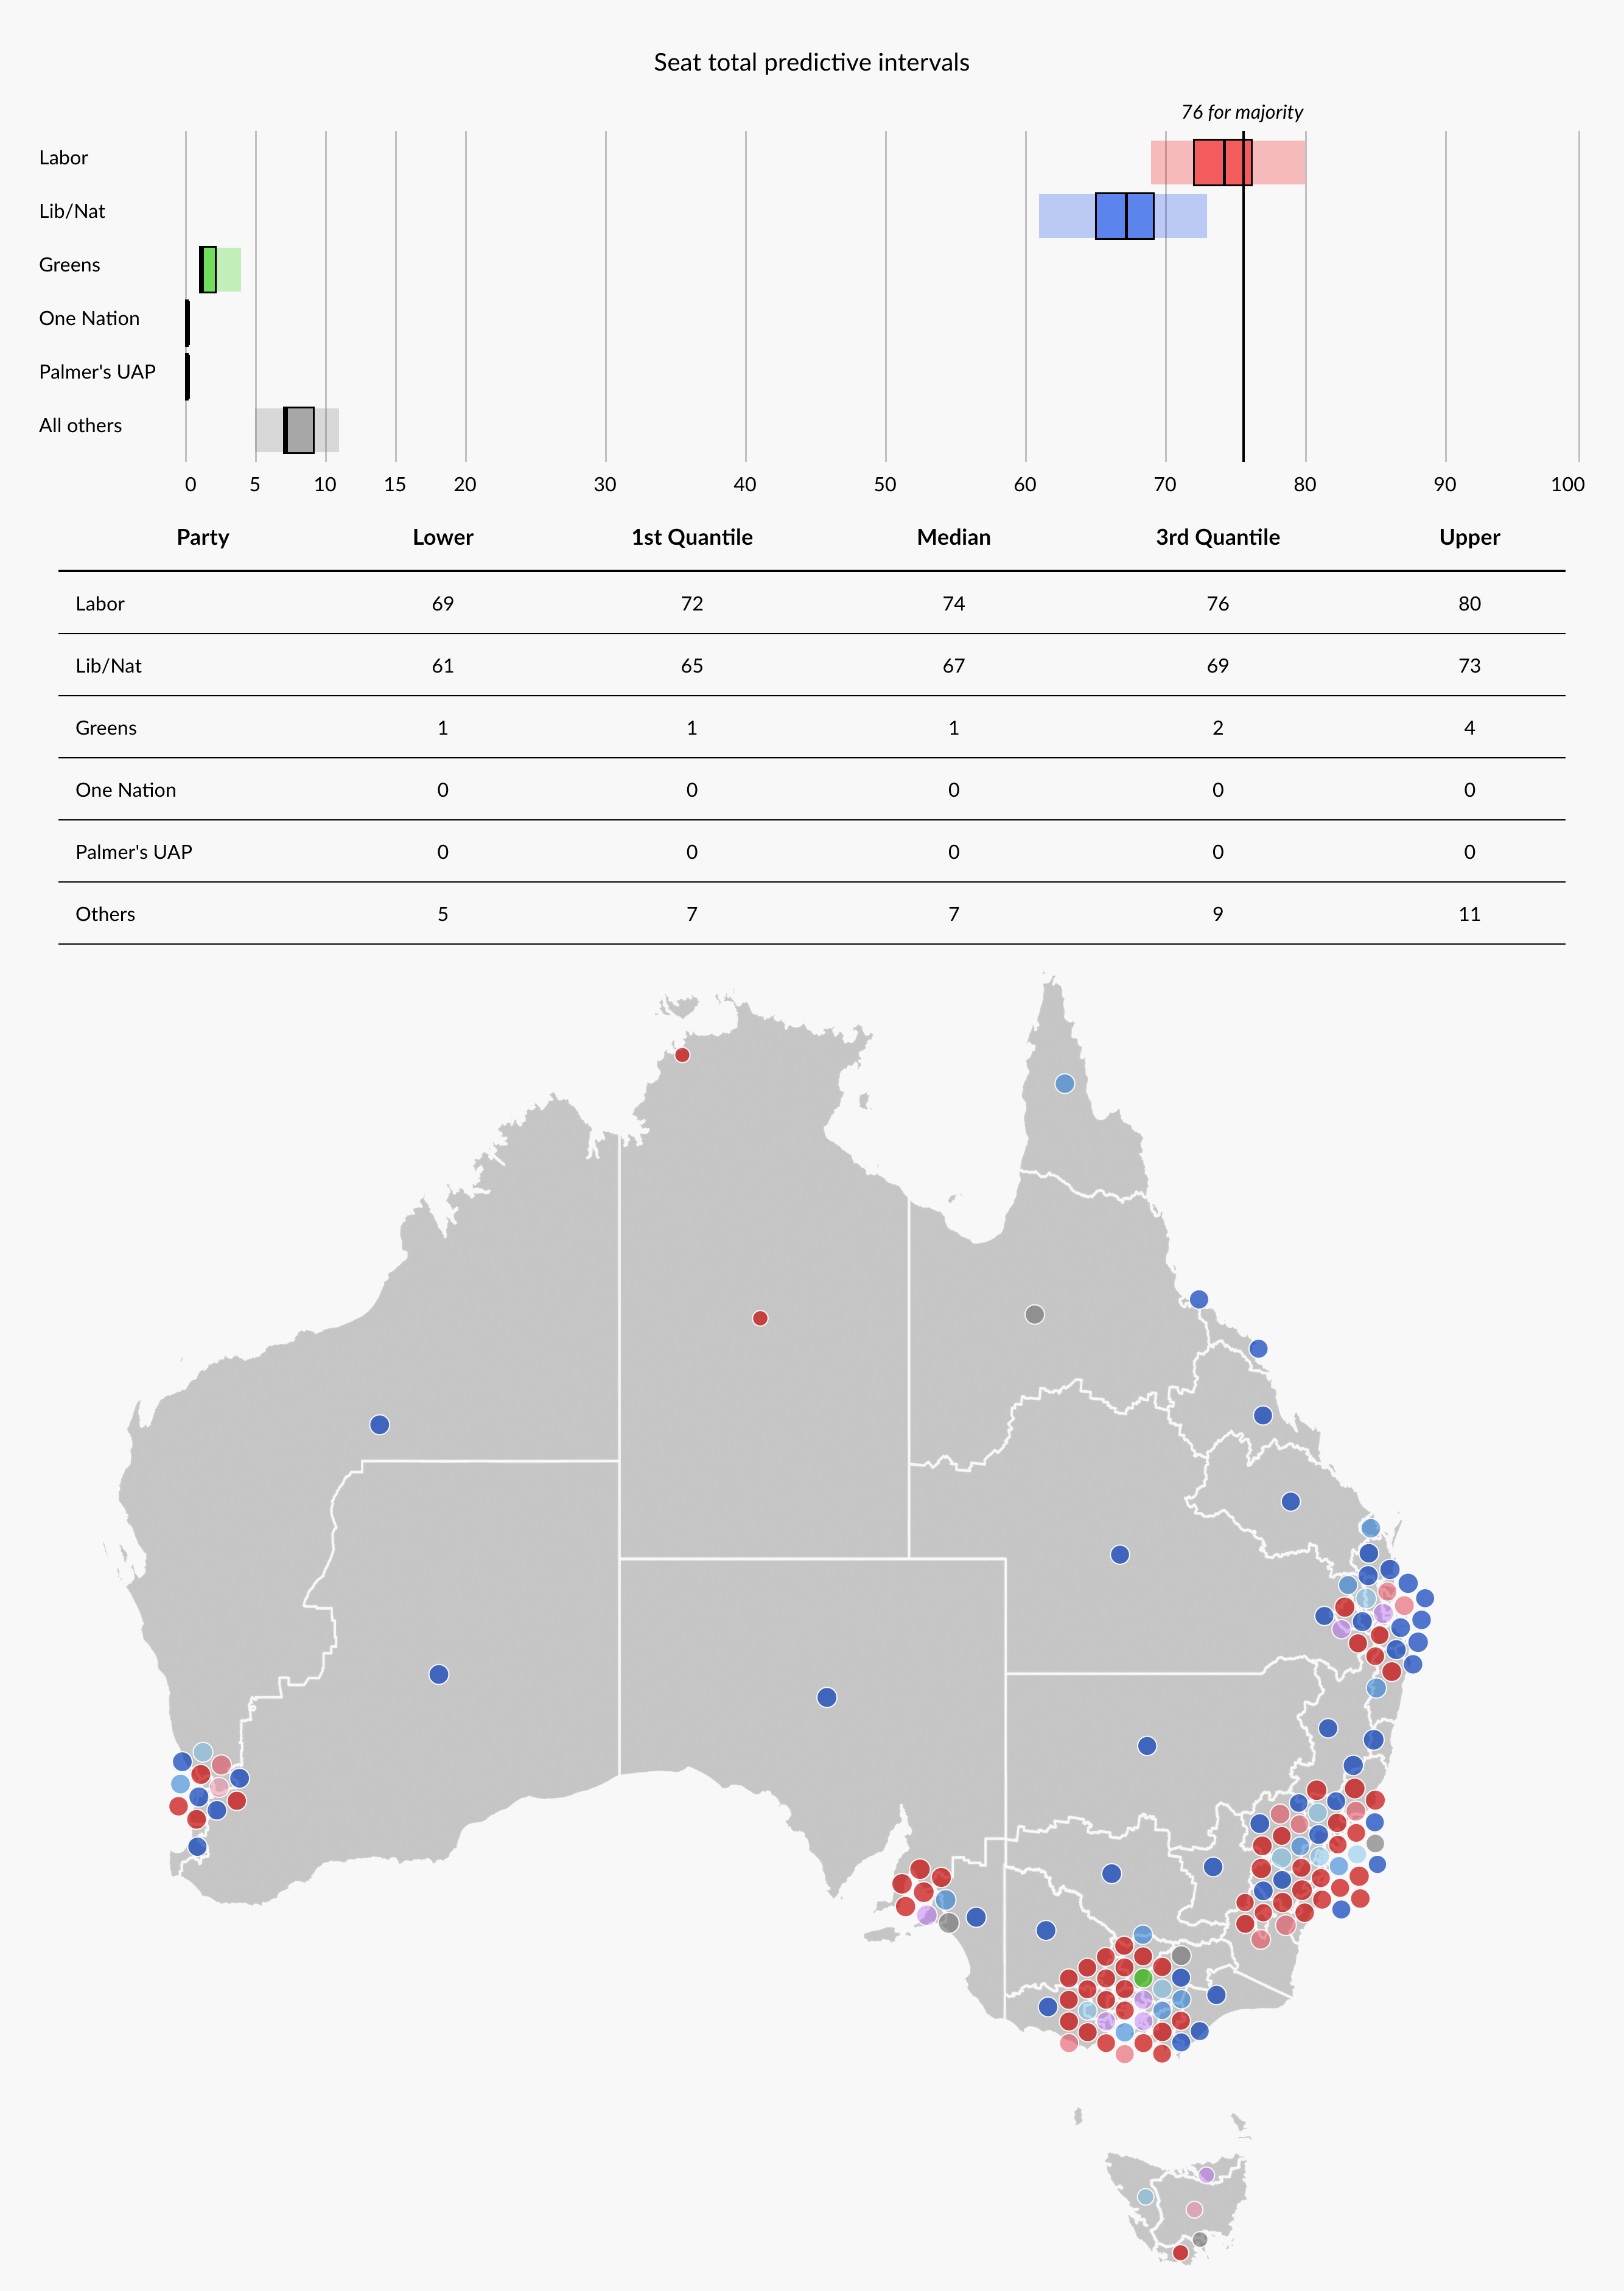
Under these circumstances, a Labor majority is plausible but only happens 1-in-3 times (32%). Nonetheless, the Coalition would still find it very difficult to assemble a majority under these circumstances – they would have to hold all their seats under threat by independent candidates and also ensure that the 2.5% swing to Labor lands in all the right electorates (either safe Labor-held seats, or ultra-safe Coalition-held seats). The Coalition gets ahead of Labor on seat totals about once every ten simulations (8%), while there is a nearly 9-in-10 chance (87%) that Labor ends up with more representatives than the Coalition.
It’s difficult for the Coalition to even get to a plurality (more seats than Labor) in this scenario, where Kooyong and Goldstein are tossups between the Liberal/Independent and the Coalition candidate is favoured to varying degrees in all other Coalition/Independent match-ups. Even if you think my model is overrating the chances of an Independent pick-up, assuming one Independent seat flips back to the Coalition in every simulation boosts the Coalition’s probability of a plurality to just over 1-in-10 (11%), and brings down Labor’s probability of a plurality to 4-in-5 (84%) – a fairly small difference.
(if these probabilities seem high to you, remember that this is attempting to model the seat totals knowing what the election result is – i.e. not including the possibility of further polling error on top of the one modelled. Labor’s odds of a majority would be much smaller if the polls were at ALP 51.)
Hence, it is very likely that Labor would end up ahead even if a repeat of the 2019 polling error occurred. They might not reach the magical 76, but they would probably have the option to govern in minority should they choose to.
But what about weirder scenarios? Could a rising minor party vote, on top of a 2019-sized polling error, threaten Labor’s hopes of forming government?
Minor Parties – The Phantom Menace
There’s many ways to model a major-to-minor swing, which produce varying shifts to probabilities. In this scenario, I make the following assumptions:
- Combined major party vote down to 67%. That’s the lowest I’ve seen so far in recent polling (Resolve’s end-April poll). Currently, the average combined major party vote in my model is about 72% (with a fair bit of variation by simulation), so this would be a swing of -5%.
- The decline in the major party vote is split up between multiple minor parties/groupings. While a straight major-to-one-minor swing would have bigger impact on seats won, in my view it is very unlikely that one minor party will be the sole beneficiary of the drop in the major party vote. Hence I have opted to divvy up the 5% swing from above into +1% GRN, +1% PHON, +1% UAP, and +2% IND/OTH.
- Both major parties see roughly equal declines in their primary vote. The minor party gains above roughly correspond to a 50/50 split on last-election preferences, so I think it’s fairly reasonable to assume that it’d take equally from both majors as well.
First off – what if there is a fairly small error/shift on the two-party vote (1%) favouring the Coalition, in addition to the major party vote dropping to 67%?
Scenario 3A: Minor parties gain, little two-party error
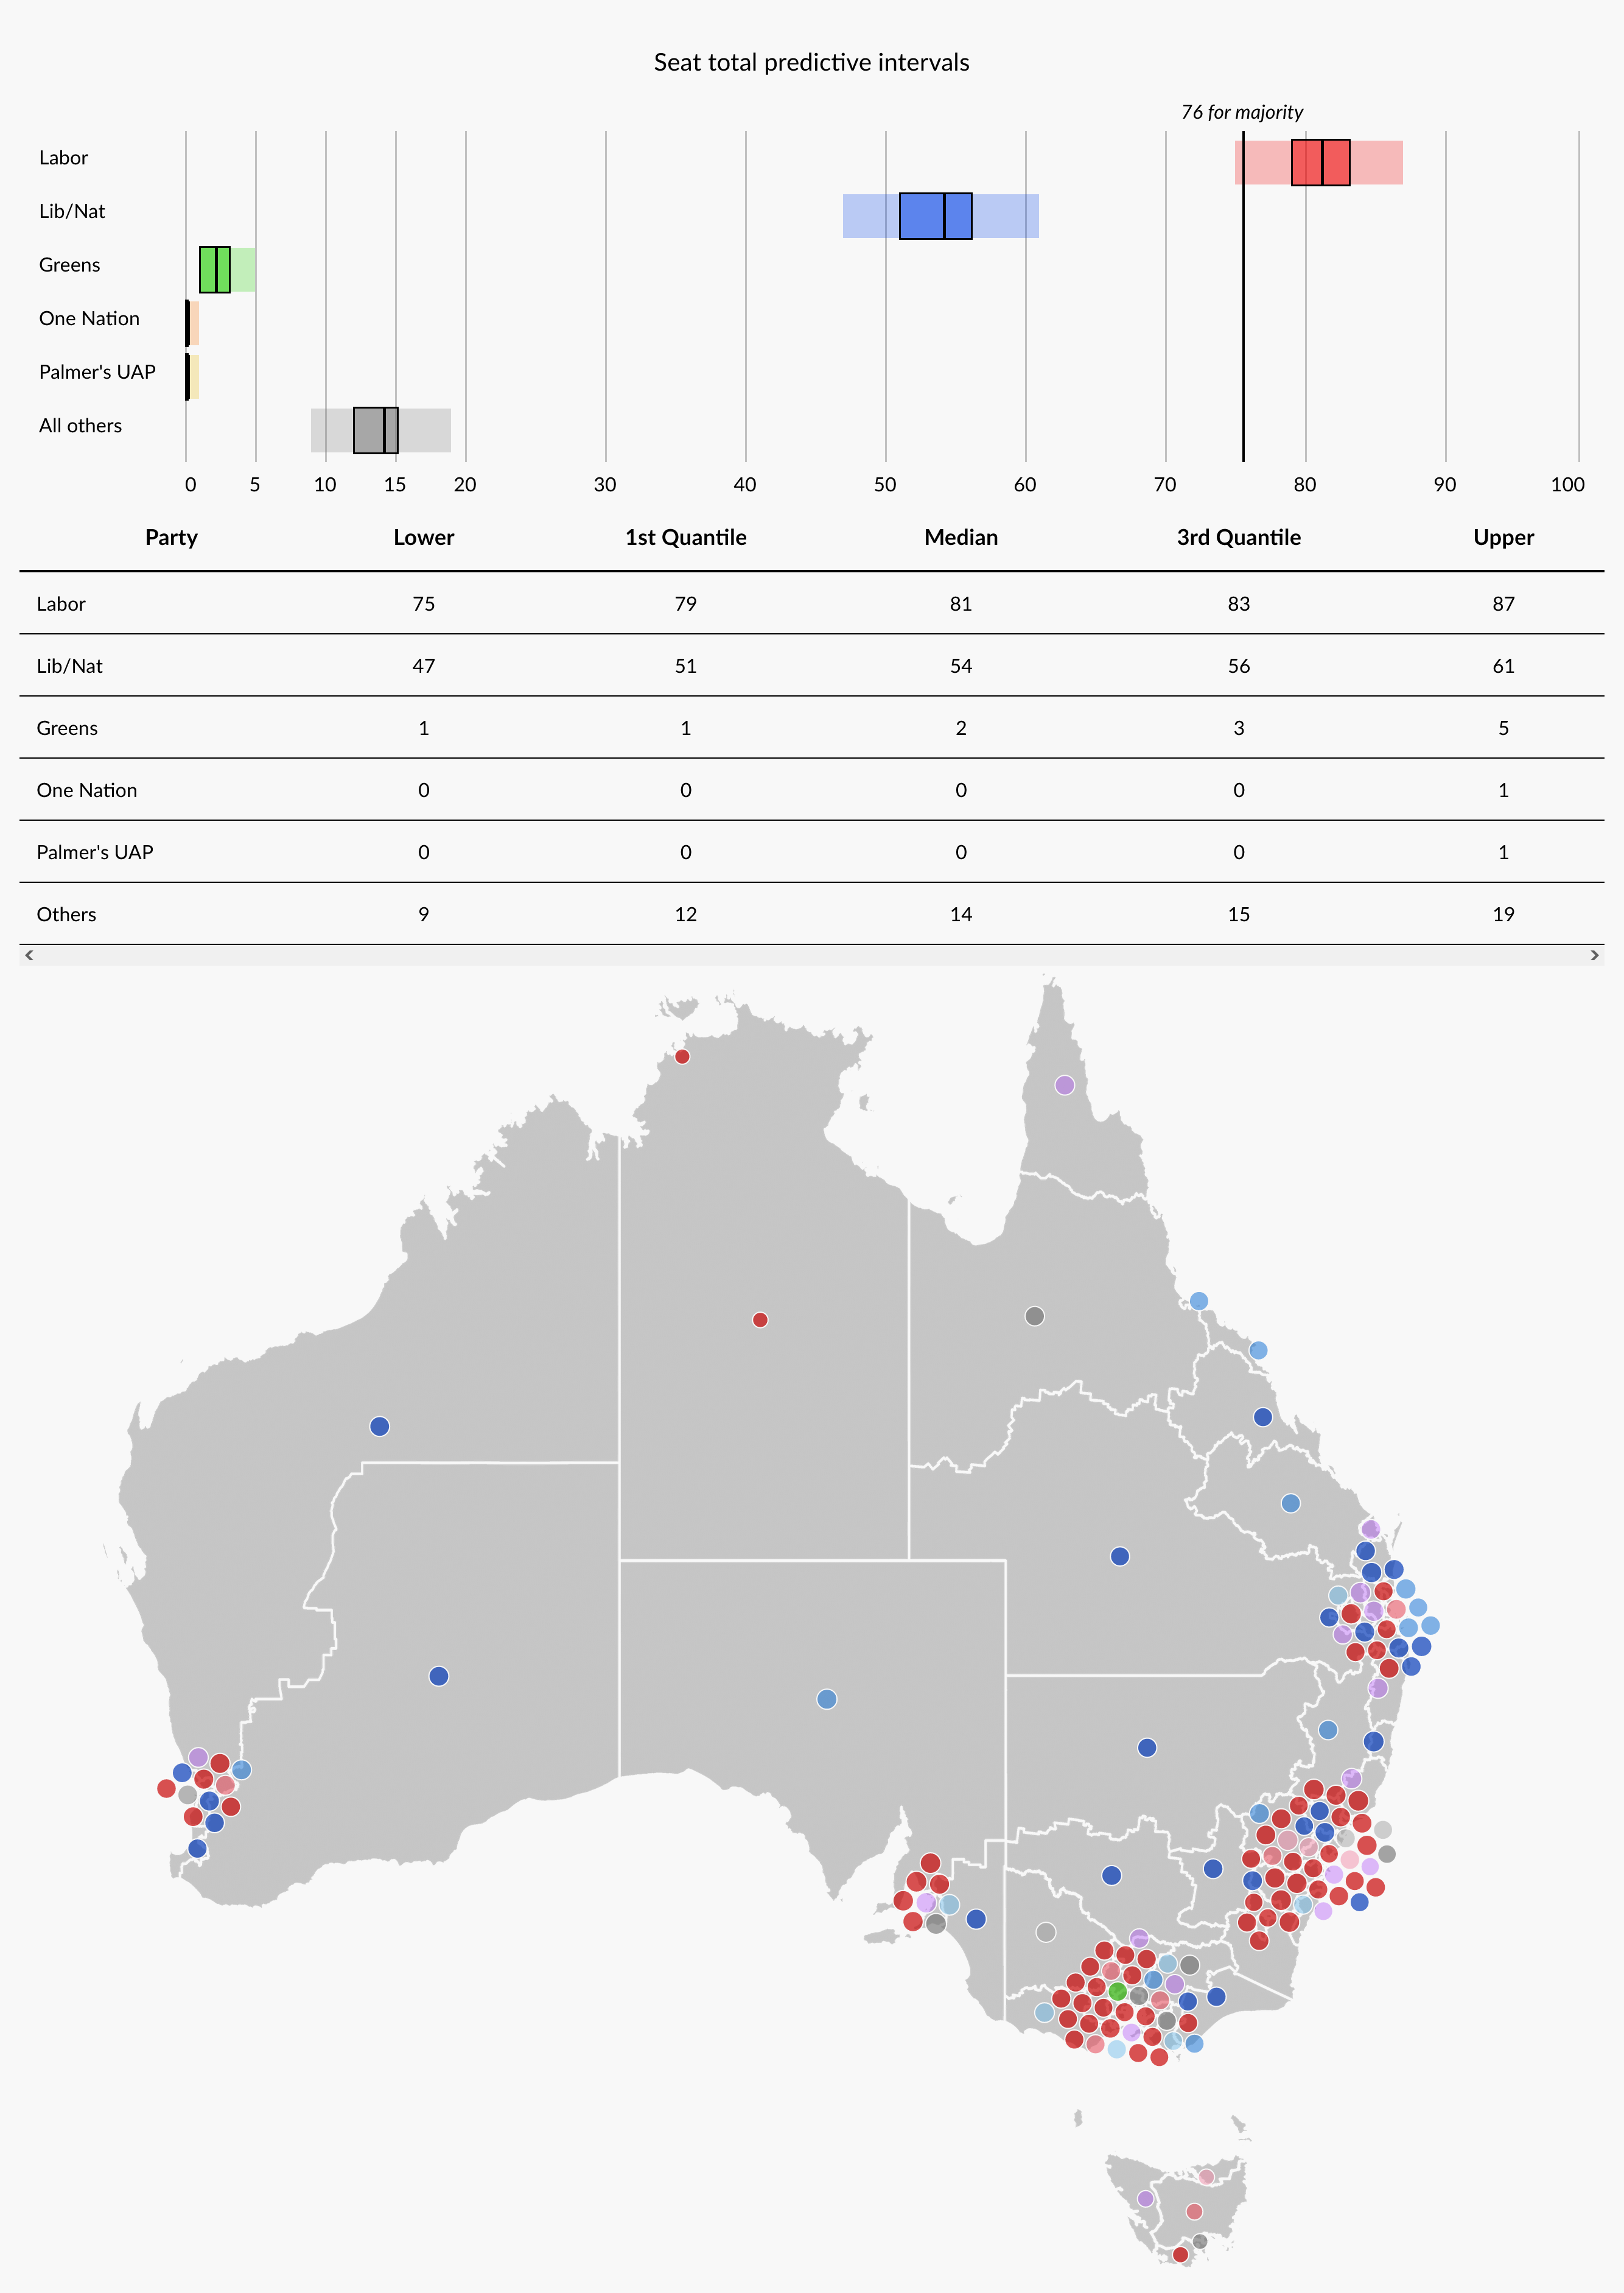
If Labor won 53 on the 2pp but the major party vote fell to 67%, Labor would still be heavily favoured for a majority, losing just one or two seats on average to the rising minor party and independent tide. They fail to hit majority just once every 30 simulations (3%); and in most of those simulations they will very likely form a minority government anyway.
This is why a lot of discussion tends to focus on the two-party-preferred as the key barometer of success for either major party. Primary votes do matter, but unless the two-party-preferred is close (< 52%), whichever side is ahead on the 2pp will be heavily favoured for a majority. Things can of course change if the major party vote falls to the point where something close to a majority of contests are major-vs-minor/independent, but 67% is nowhere near that point – even in this scenario 4 in every 5 simulated contests ended up being Labor-vs-Coalition.
Now, what if the minor party rise was combined with a 2019-sized polling error on the two-party vote?
Scenario 3B: Minor parties gain, 2019-sized two-party error
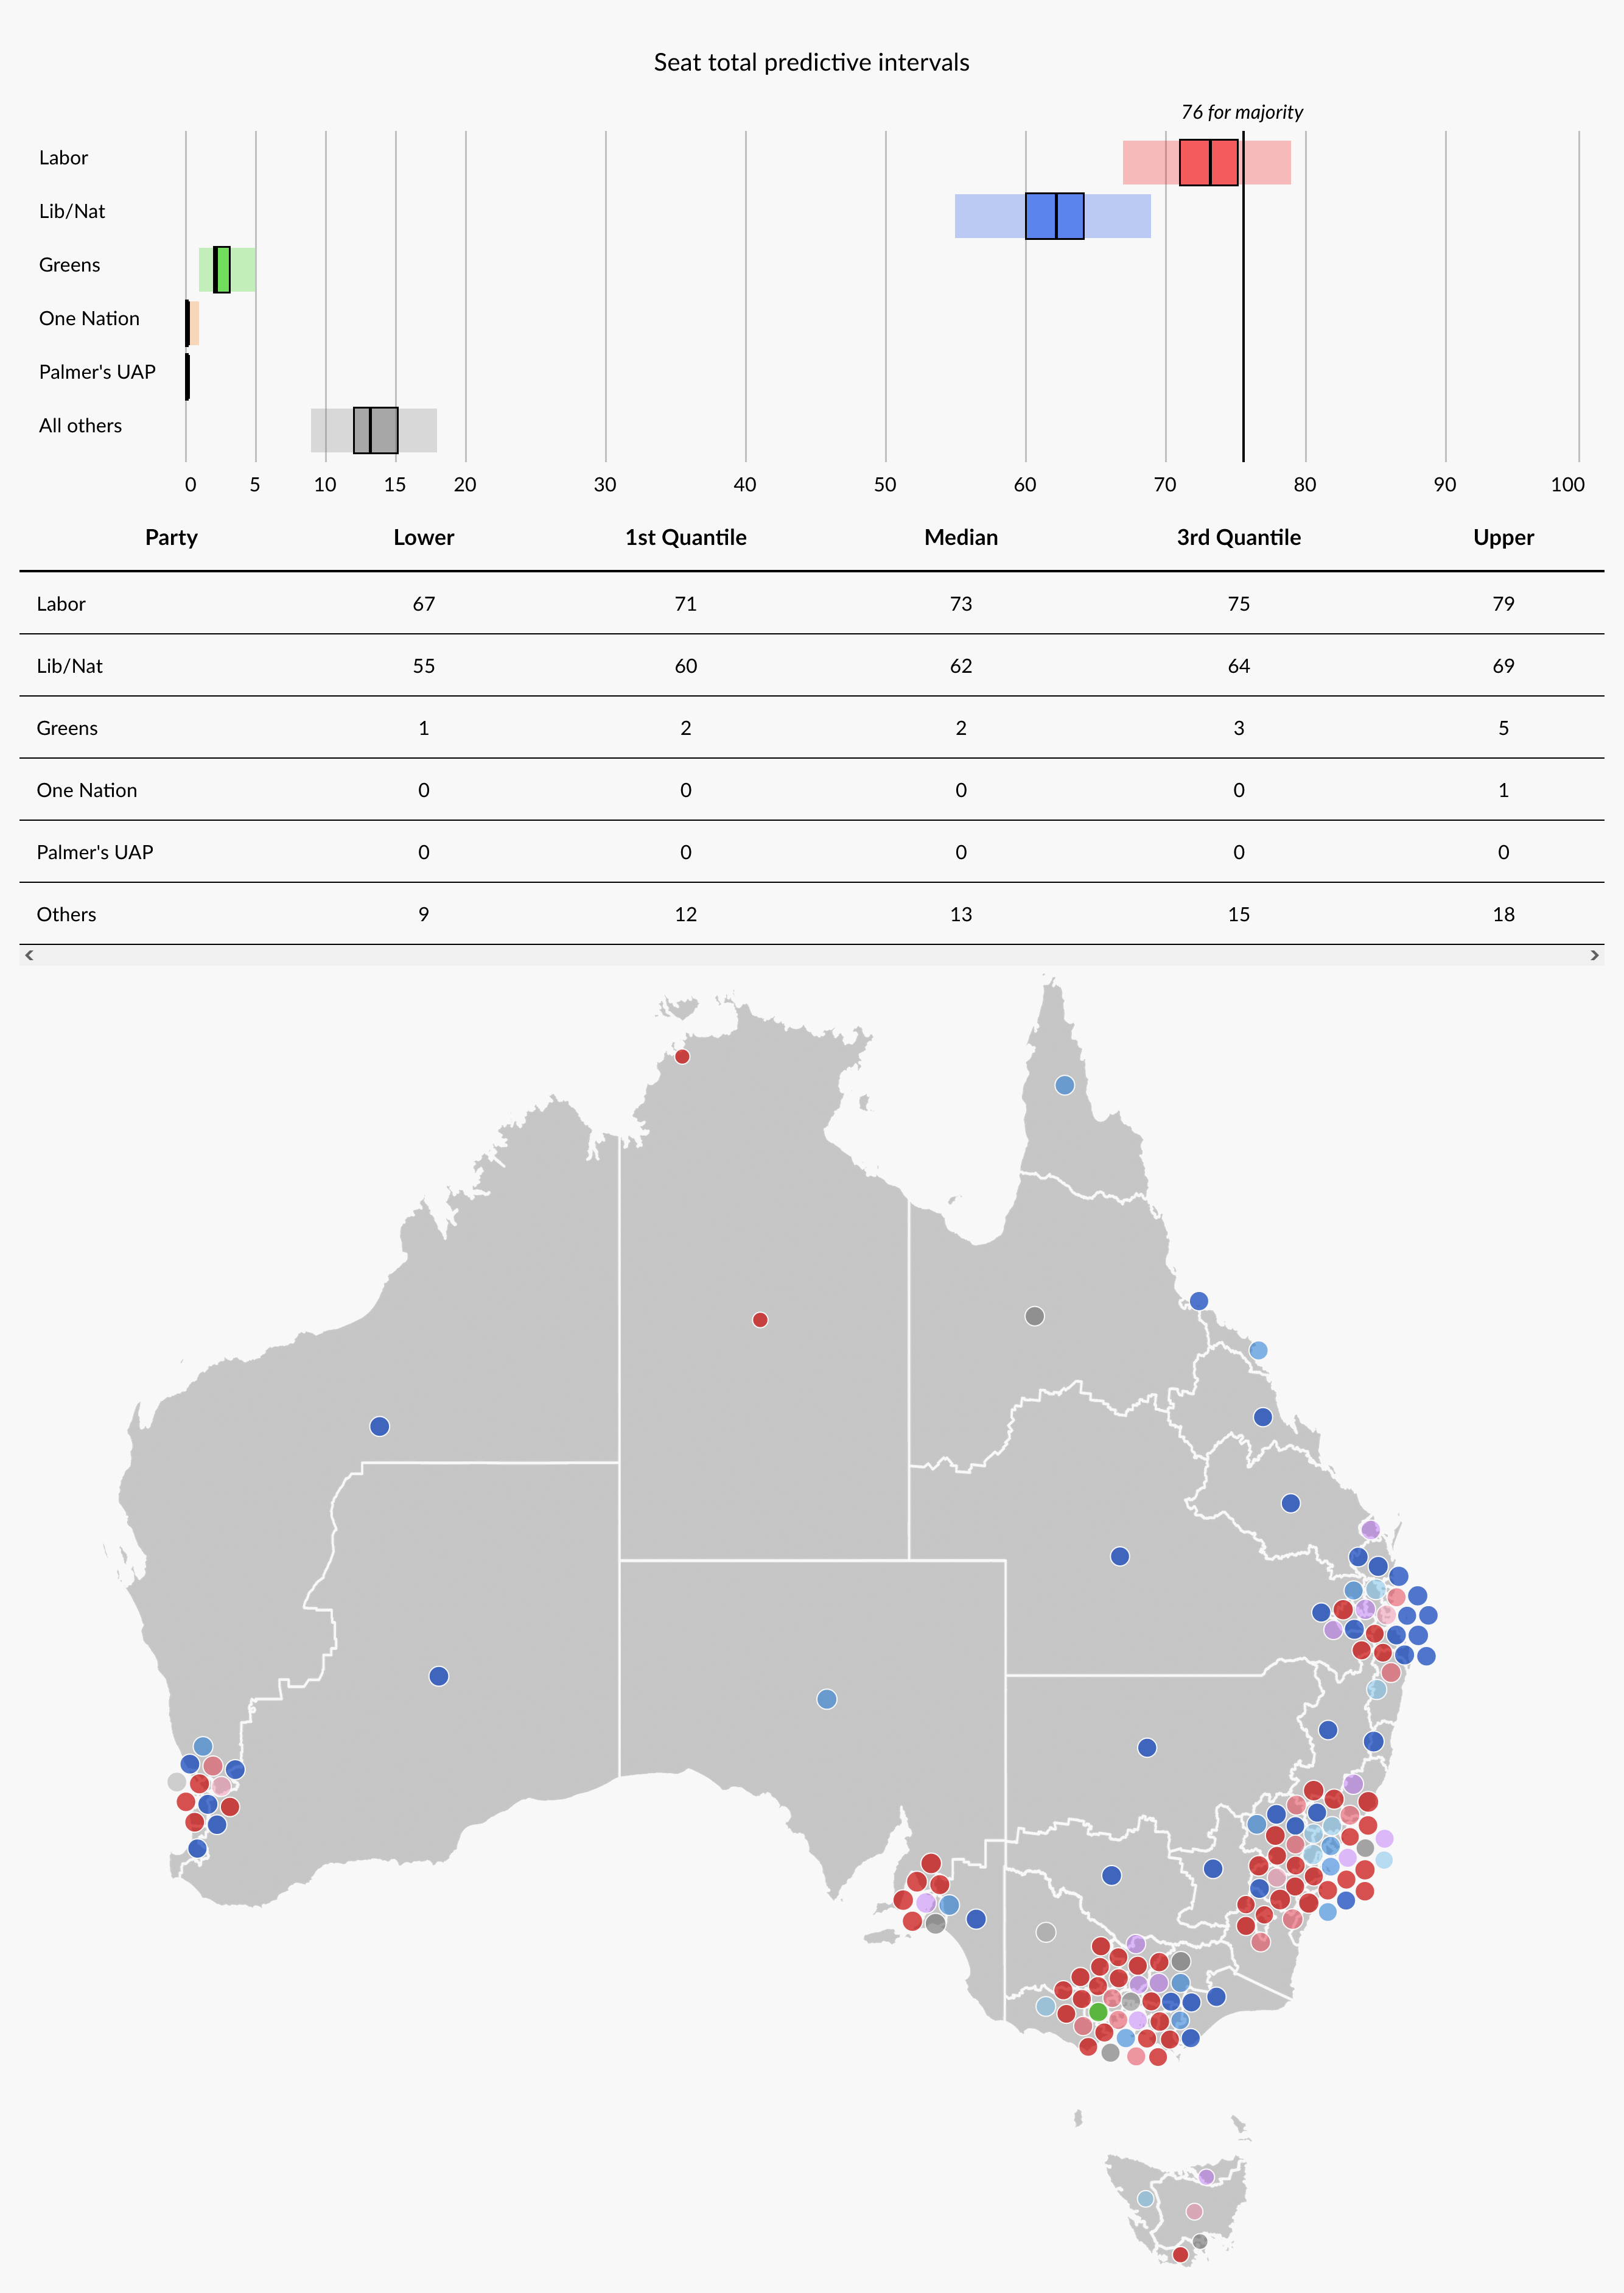
Under a much tighter two-party vote and strong minor party vote, the odds of a hung parliament in some form rise massively. Labor would find it harder to cobble together a majority, winning the required 76 once in every six simulations (16%). However, the Coalition would be even more hard-pressed to find the seats for a majority; the rising independent vote would cost them more seats on net than Labor due to the concentration of plausible Independent gains in Coalition-held electorates, putting a majority pretty much out of reach.
The surge of independents and minor parties would also make it a lot harder for the Coalition to overtake Labor on seat totals; the odds of that happening despite the crossbench surge drop to 1-in-30 (3%). This means that Labor would still be very likely ahead even if there was a 2019-sized polling error, coupled with a historically-low major-party vote.
What if the swings land in all the right/wrong places?
Whew. So to recap, Labor would likely form a majority if the polls under-estimated the Coalition by about the same margin they under-estimated Trump, or if the polls were only slightly off on the 2pp but over-estimated the major parties. A Labor majority would be less likely if the polls were off by the same margin as they were in 2019, but it’s still very probable that Labor ends up with more seats than the Coalition anyway, in which case they would be favoured to form a minority government.
But what about the marginals? I heard someone say the marginals are close! What if Labor can’t win the marginals?
First off, I don’t really think that describing all marginal electorates as “the marginals” is a useful method of analysis. Inner-city Brisbane, rural Tassie Braddon, mining-town Hunter and provincial Macquarie are all “marginal”, but grouping them together glosses over the huge variation between them and ignores the fact that what appeals to one may not appeal to another. Saying that a party is doing better or worse in “the marginals” is like saying that a party is doing better or worse with “the voters”, and should always elicit the same response – “which ones?”.
Anyways. It’s generally rare for one side to systematically do better swing-wise across marginal electorates, unless they gained a lot of seats at the last election and hence have newly-installed incumbents to hold down the fort. Still, one way to model this is to find which traits correlate with being a marginal electorate, and shift the electorates with marginal-like demographics to the Coalition while shifting the electorates with non-marginal-like demographics to Labor (to maintain the overall 2pp).
For demographics which correlated with 2pp margin at greater than r = 0.1, I applied a swing deviation of 0.2% to the Coalition per +1 standard deviation of a demographic which correlated with being marginal, and a swing deviation of 0.2% to Labor per -1 standard deviation of the same demographic. Figures would be reversed for demographics which correlated with an electorate being safe instead.
I then added up all swing deviations to get an overall swing deviation per electorate. The standard deviation produced in the swing deviations by this method is about 1.6% which would be about 20% of the squared mean deviation from uniform swing.
My data is available here if anyone wants to replicate my findings.
Doing so and re-running the votes-to-seats simulation with the assumption of a 2019-sized polling error, we get the following output:
Scenario 4: 2019 polling error + sandbagging Coalition marginals
(click here if you want to compare it with our earlier, vanilla Labor 51 simulation)
The difference is fairly minimal; on average Labor loses a seat or two and the Coalition gains a seat or two. However, Labor would still come out ahead most of the time; either with a narrow majority (1 in 6 simulations, 16%) or with more seats than the Coalition (3 in 5 simulations, 61%).
This is the most favourable scenario for the Coalition yet, with a 1 in 6 chance that they hold more seats than Labor (17%). However, before anyone goes and extrapolates anything from this, I’d like to point out how unlikely such a distribution of swing would be; when given the right 2pp, uniform swing usually gets within +/- 3 seats of the total on average. Additionally, it’s also unusual for the swing to be distributed such that it manages to sandbag one side’s marginals while not exposing its previously-safe electorates. A swing has to go somewhere; for example the Coalition might hold down Braddon but lose Bennelong, or keep Higgins but lose Page etc.
Whew. So, to recap:
- Labor is ahead by more than twice where it was at this point in the 2019 election. Their current lead in the polls is 54% as opposed to the 51.5% they were averaging a week out from the 2019 election; while >1.5% errors happen with some regularity, >4% errors are very rare. Labor is hence quite heavily favoured to win the two-party vote in this election.
- If Labor wins the two-party vote by a significant margin, their primary vote is unlikely to matter. A win of 53+ on the 2pp will almost certainly come with some kind of a lower-house majority. It’s worth noting that in Scenario 3A (Labor 2pp 53%, major party vote 67%), Labor still won a majority in most simulations despite having a simulated primary vote of just 34%.
- A repeat of the 2019 polling error would still see Labor ahead in most cases. Although it might not be able to win an outright majority, Labor would probably still have more seats than the Coalition and remain in a good position to form a minority government.
- The electoral map is unlikely to save the Coalition if they don’t run it close. Assuming that the marginals won’t swing as much to Labor as the rest of the nation can only get you so far. Even coupling a map intentionally favouring the Coalition to a 2019-sized polling error only flips a couple of seats to the Coalition on average; it’s not going to save them if Labor wins by more than 52 on the 2pp.
- Something much more ahistorical than 2019 would have to happen for the Coalition to be re-elected. They would either need a record-breaking polling error, or an unusually large polling error coupled with an ahistorical shift in the map to save their marginals. It can happen – there’s a reason the Coalition’s odds of a plurality in our forecast are nearly 1-in-10 – but it’s unlikely.
Hi
How do you calculate ALP on 54% 2PP when the two polls released yesterday had them nowhere near this? Newspoll is a week old now and will surely show a tightening on Friday night.
Curious to understand how you calculate this
Thanks
The article was written before the Resolve and Essential polls were released.
On last-election preference flows, I estimate an ALP 2pp of 51.6 for Resolve and 51.5 for Essential, similar to what others have estimated. I ignore the pollster-published 2pp because it is less accurate historically than simply assuming preferences will flow as they did at previous election.
On those estimates, I get the following:
-Ipsos (7/May/2022): ALP 56.2
-Newspoll (7/May/2022): ALP 54.2
-Newspoll (13/May/2022): ALP 53.7
-Morgan (15/May/2022): ALP 53.5
-Essential (16/May/2022): ALP 51.5
-Resolve (17/May/2022): ALP 51.6
A simple average would come out to about ALP 53.5; weighting each poll for recency using the average error of polls taken n days out produces a polling average of ALP 53.4.
If a 2019-sized polling error in the Coalition’s favour occurred on those polling averages, it would likely result in a very close, 2010-style election where Labor would probably get a couple of seats more than the Coalition but either side might form govt. IMO the electoral map would be a much bigger difference-maker there.
Ultimately the Newspoll will probably indicate if things have truly tightened
Rebekah & Ethan, I think it would be helpful if your election forecast post included a date and also the 2PP basis used for the forecast plus any updates. Hard to know whether to look back at it still when the 2PP changes.
2pp is already displayed in the forecast page. Don’t have the time to do a updates page/section for this election, will consider it for future elections.
Perhaps my comment could have been more clearly expressed. Your forecast certainly provides the range of possible 2PP outcomes you forecast results from. What I meant is it would be helpful if you displayed the 2PP polling results that the forecast is based upon, plus the date of the forecast.
The Resolve Poll is not to Australian Standard and they changed methods mid stream.
Essential poll – used flawed method.
IPSOS Poll has Labor 53/47.
Newspoll will be Simular to IPSOS.
Majority of the sites like this site and AEForcasts predict Labor Majority.
The probabilistic forecasts I’ve seen predict a Labor majority more likely than not, but there is still a small but realistic chance of a Coalition win either in minority or majority – not dissimilar to the estimated probability of a Trump win prior to the 2020 US presidential election.