Edit (10/May/2022): Note that this piece was written about 240 days out from an expected May/2022 election. Depending on how close you are to an election, the advice in this piece may no longer apply.
If you read about polls on social media, and happen to scroll down to the comments/replies, you will almost certainly have come across discussion of this sort:
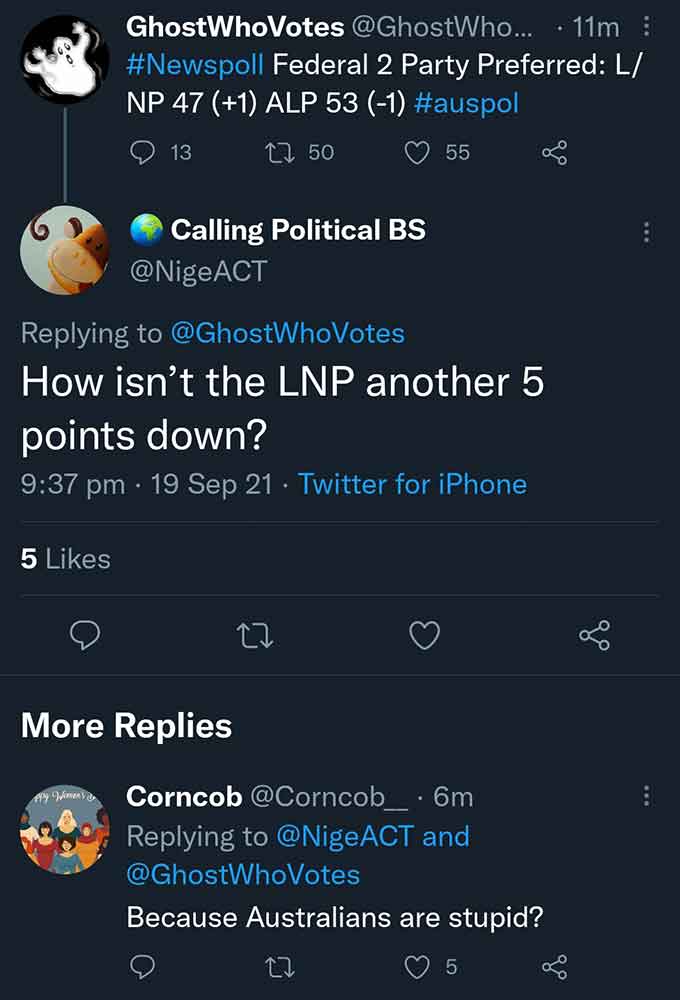
You know what’s going to persuade people that your politics is correct? Calling them idiots. 100% success rate. I heard that slavery ended in the USA when Lincoln just called the South idiots really really harshly, and Mussolini became an ardent democrat when the press published some mocking cartoons.
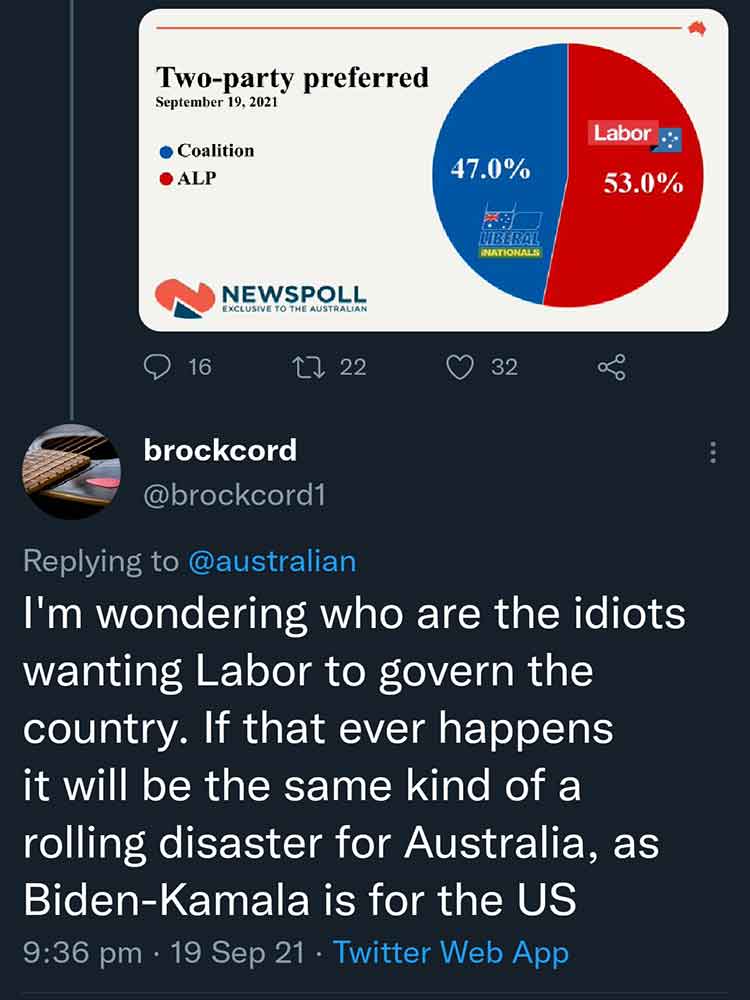
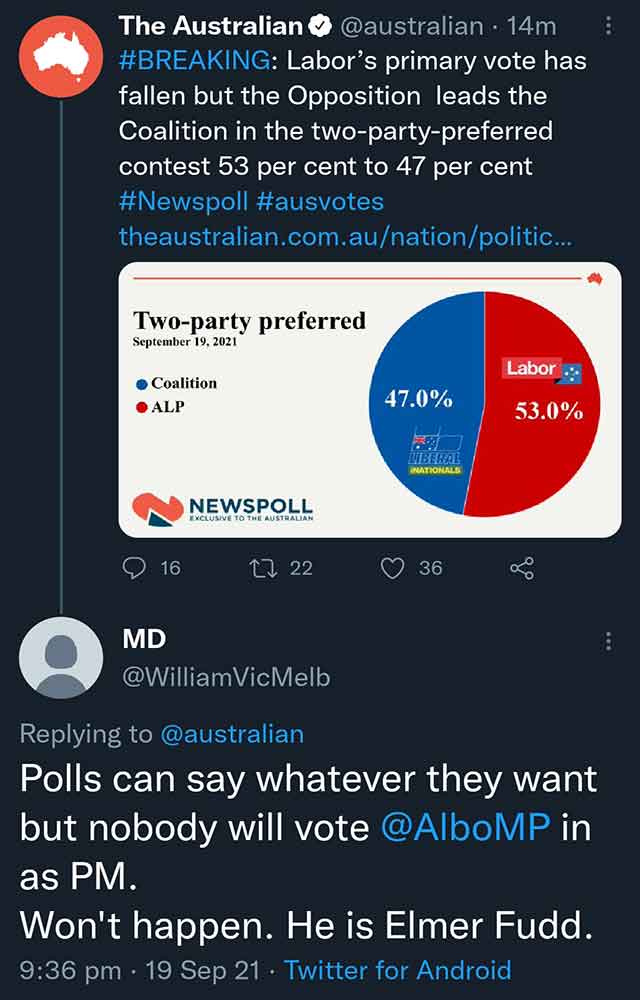
In particular, there was a Resolve Political Monitor poll of federal voting intention a few weeks back which provoked rather strong reactions, all because it didn’t show Labor leading the same way other pollsters had for a while:

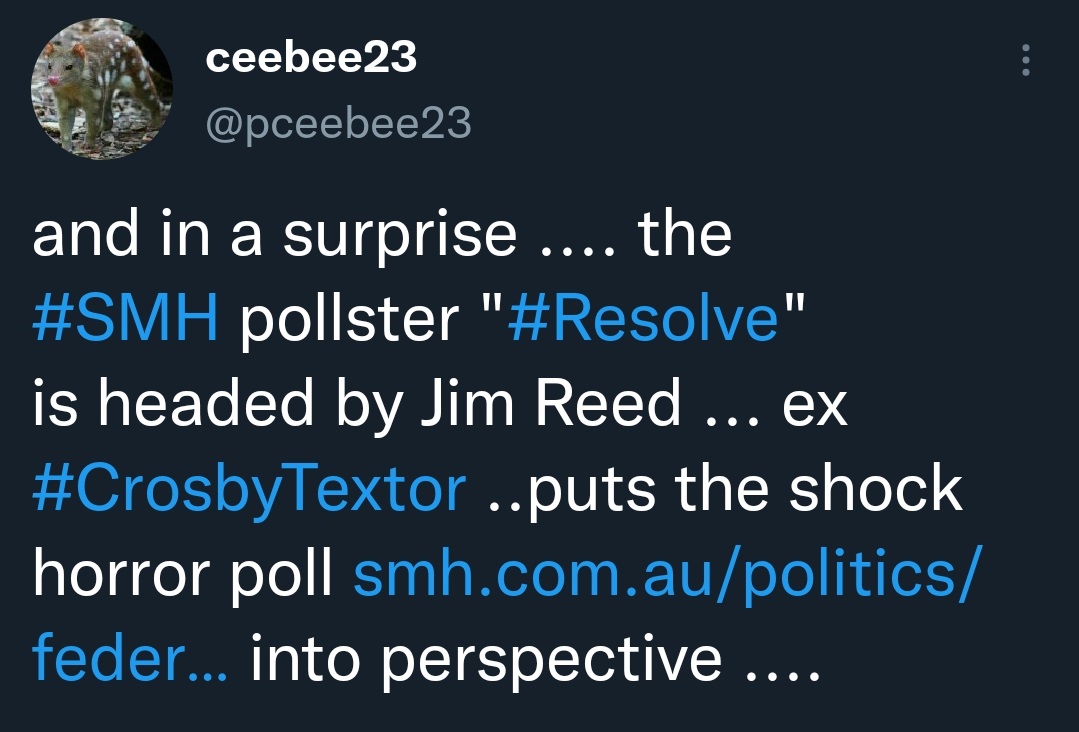
Images sourced by Ethan, who says “I’d go to other social media to find more, but I don’t want to lose too many brain cells to diffusion”
However, is any of this freakout even warranted? Do polls at this point have any predictive power when it comes to the following election? Or does voting intention shift so rapidly that leading/trailing in polls at this point doesn’t really make much of a difference to who wins the actual election?
Let’s find out, shall we?
Further away, higher error rate
Between the enormous generosity of psephologists like Kevin Bonham and William Bowe, along with hours of our own lives spent scraping polls off the web, we’ve compiled a fairly wide database of polling. It stretches back to 1943, across a multitude of ever-morphing and renaming polling agencies: we have MorganPoll, MorganGallup, and Morgan; Essential, Resolve, Ispos, ReachTEL; AGB-McNair, ACNielsen; YouGovNewspoll, GalaxyNewspoll, and just plain Galaxy. We even have some minor ANOP and Spectrum polls in there from 1983. This is the kind of store of raw data that we’ve needed to construct our models and forecasts. The kind of store that can also display the sprawling range and quicksilver fickleness of public opinion in polling. Because, frankly, polls further than about a month out from the election can’t be taken to indicate the election itself. It would be incorrect to call them erroneous – we have no way of checking if they accurately measured public sentiment at the time. But to believe that they are predictions of an election further than 40 days out is to condemn them to error.
Thus, visual demonstration!
For every poll, we’ve plotted the gap between the published two-party-preferred (2pp) of a poll and the election result, against how many days the poll was taken from election day. Remember that this is not the same thing as polling error – the polls taken e.g. 200 days out from an election might accurately reflect voting-intention 200 days out from that election, but they’ll still be “off” compared to the final election result.

(This of course doesn’t include any post-2019 polls, as we don’t yet have an election to compare them to.)
As you can see, at a thousand days before the election, polls can range from exactly on target to nearly 15% out. The likelihood of extreme outliers drops only very slightly over the following few years, and the average poll-election disparity barely declines, until the last few weeks before the election, when the polls suddenly begin to dovetail much more closely to the future results.
If the mass of polls is hard to read, here are contemporaneous polls averaged together.

So raw poll numbers are most worth paying attention to in that short window before the election actually occurs. Polls before then are a much more random toss-up of possibilities, and on average anywhere between 2-4.5% off the final result.
But there are some other patterns that we can draw within the noise.
Polls taken too far out historically tend to over-estimate certain groups
In theory, polls taken further out could still be useful if they “called” the correct winner even if they’re always off the actual result. For example, if polls taken a year out always called the right winner but tended to under-estimate their winning margin by 3%, they could still be useful for predicting who will win even if they don’t help much with predicting how much they’ll win by.
(in fancier terms, the polls could be useful if they’re directionally accurate even if they’re off on the magnitude)
However, this is not the case. First off, as Dr Bonham has discussed before, the incumbent government tends to recover in Newspoll from this point to election day. We find that a similar effect applies to all polls, which we’ve termed the late-term dip. Secondly, the trailing party, the one not currently winning in the poll, also tends to regain polling points in the last few weeks before the election.
Incumbents tend to out-perform late-term polls
The late-term incumbent dip often (read: not always) kicks in around from 400-40 days out from the election. When we measure the direction of the polling shift to election day (e.g. did polls for the government 200 days out over- or under-estimate the government by election day) we find a tendency for the incumbent to underperform in the polls relative to the election; that is, polls taken a month to a year out from an election tend to show weaker results for the incumbent than compared to the actual election result.

To make the effect a little clearer to see, we averaged all poll differences by the same-day categories as above and then plotted the averages:

We ourselves are currently in the incumbent dip period. The election date has not yet been called, but a minimum campaign period is 33 days; the election has to be called by May 2022. See Antony Green for more details. We should expect polls to be less in favour of the incumbent than the final result. We can estimate that the Coalition is probably being underestimated by 0.5% – 1% right now – though we won’t know for sure until we hit the election. There have been elections where the late-term incumbent shift does not occur, such as the Coalition benefited from a honeymoon bounce when replacing Abbott with Turnbull in 2016.
The party behind tends to recover ground
The second pattern in polling is for the leading party – whoever they might be – to do better in the run-up than they do at the finish line. This occurs even after we adjust for the late-term incumbent effect. The trailing party wins ground at the election against all the early polling, and the very latest polling often reflects an upturn in their prospects. We should expect leading parties to drop by at least 1% from polling that’s more than a month out. This is true regardless of if the leading party is currently in power or not, and also regardless of whether they end up winning or not. If they do win, they will do it by less than predicted (except in crazy cases, like WA 2021, where literally everyone underestimated Labor because a) we had far too little polling, and b) the Labor margin was so insane that few of us could believe it anyway).
For the more visual among us, here’s our polls, averaged together by time period, mapping how much the polls underestimate the trailing party as they get closer to the election. As you can see, even polls within a year (365 days) of the election tend to give the trailing party 3% less than they’ll get by ballot day. And while leading party margin does decrease somewhat over time, like the incumbent late-term effect and polling-election disparity, it only really takes a nose dive in the last month.

Furthermore, we know this isn’t just isolated to polls that pushed unrealistically big leads in the first place. Take polls further than a year out, and then break them up by the size of the lead, and measure how much the lead drops. You find that across all lead sizes (whether the first party is 0.5% ahead or 9% ahead) they will still lose ~80% of their lead. In other words, it’s not just the big leads that collapse, but the small ones as well, even if the declines in the small ones are less dramatic.
| 2pp lead sizes | Average 2pp lead | Avg. decline in lead | Decline as fraction of lead | Number of polls |
|---|---|---|---|---|
| 50% - 51% | 0.48 | 0.41 | 0.854 | 265 |
| 51% - 52% | 1.49 | 1.29 | 0.866 | 268 |
| 52% - 53% | 2.45 | 2.4 | 0.98 | 294 |
| 53% - 54% | 3.45 | 2.78 | 0.806 | 314 |
| 54% - 55% | 4.42 | 3.76 | 0.851 | 210 |
| 55% - 56% | 5.43 | 4.45 | 0.82 | 149 |
| 56% - 58% | 6.83 | 5.89 | 0.862 | 188 |
| 58% - 60% | 9.01 | 8.1 | 0.899 | 60 |
| Average | 3.5 | 3.03 | 0.866 | 1778 |
For the entire pre-election period, therefore, polls tend to be several percentage points off the final election result, while also consistently underestimating the party currently behind. Furthermore, the late-term incumbent swing features prominently in the 400-40 day period, which we are currently in. Polls at the current moment may be useful for data analysis: when we know the patterns we can adjust for them. But keep in mind those patterns, and then also the enormous historical variability of polls at the current moment. Here’s the first graph we showed you again, demonstrating the disparity over time between poll results and the actual election results (with a slight addition).

That dashed line we added represents the average “error” you would get if you predicted that the 2pp at every election would be 50-50. The purple solid line, as before, represents the average gap between polls taken at each time-point and the election result (fitted with a logarithmic function).
In other words – even at this range of possible points out from the election, polls still demonstrate wild variety, and have historically been less accurate than simply assuming the election will be a 50-50 proposition. Near day 200, we once had a poll that was nearly 13% off the actual election result. We also had polls that were bang-on the future target. In any given election cycle, for any given agency, on any given day, you cannot differentiate which ones they will be.
Of course, the position and movement of polls is informative. It becomes especially so in the last month or so pre-election, when the profusion of them begin to highlight trends and common consensus. But individual data points are unreliable, and there’s no need for uproar when margins swiftly change or parties seem to be losing or governments are in disfavour. This is all normal poll behaviour. Feel free to pay more attention to them, in all their multitudes, in the last month. But at least for now, and at least until an election date is announced, don’t count on the polls to tell you what will happen.
Is There A Shy Tory Effect In Australian Polling?
Examining whether Australian polls tend to under-estimate support for conservative parties and causes, as well as determining if any effects are due to “shy Tories” or to sampling issues.