No polls! Polls bad! They failed in 2019 and with Trump and remember Brexit? Our model predicts all those correctly!
(NOTE: If you think I’m saying that the economy either completely explains voter behaviour, or that the economy does not affect voting intention (it does), or that non-polling models work perfectly/don’t work at all, you’re missing the point. Please read to the end of the piece.)
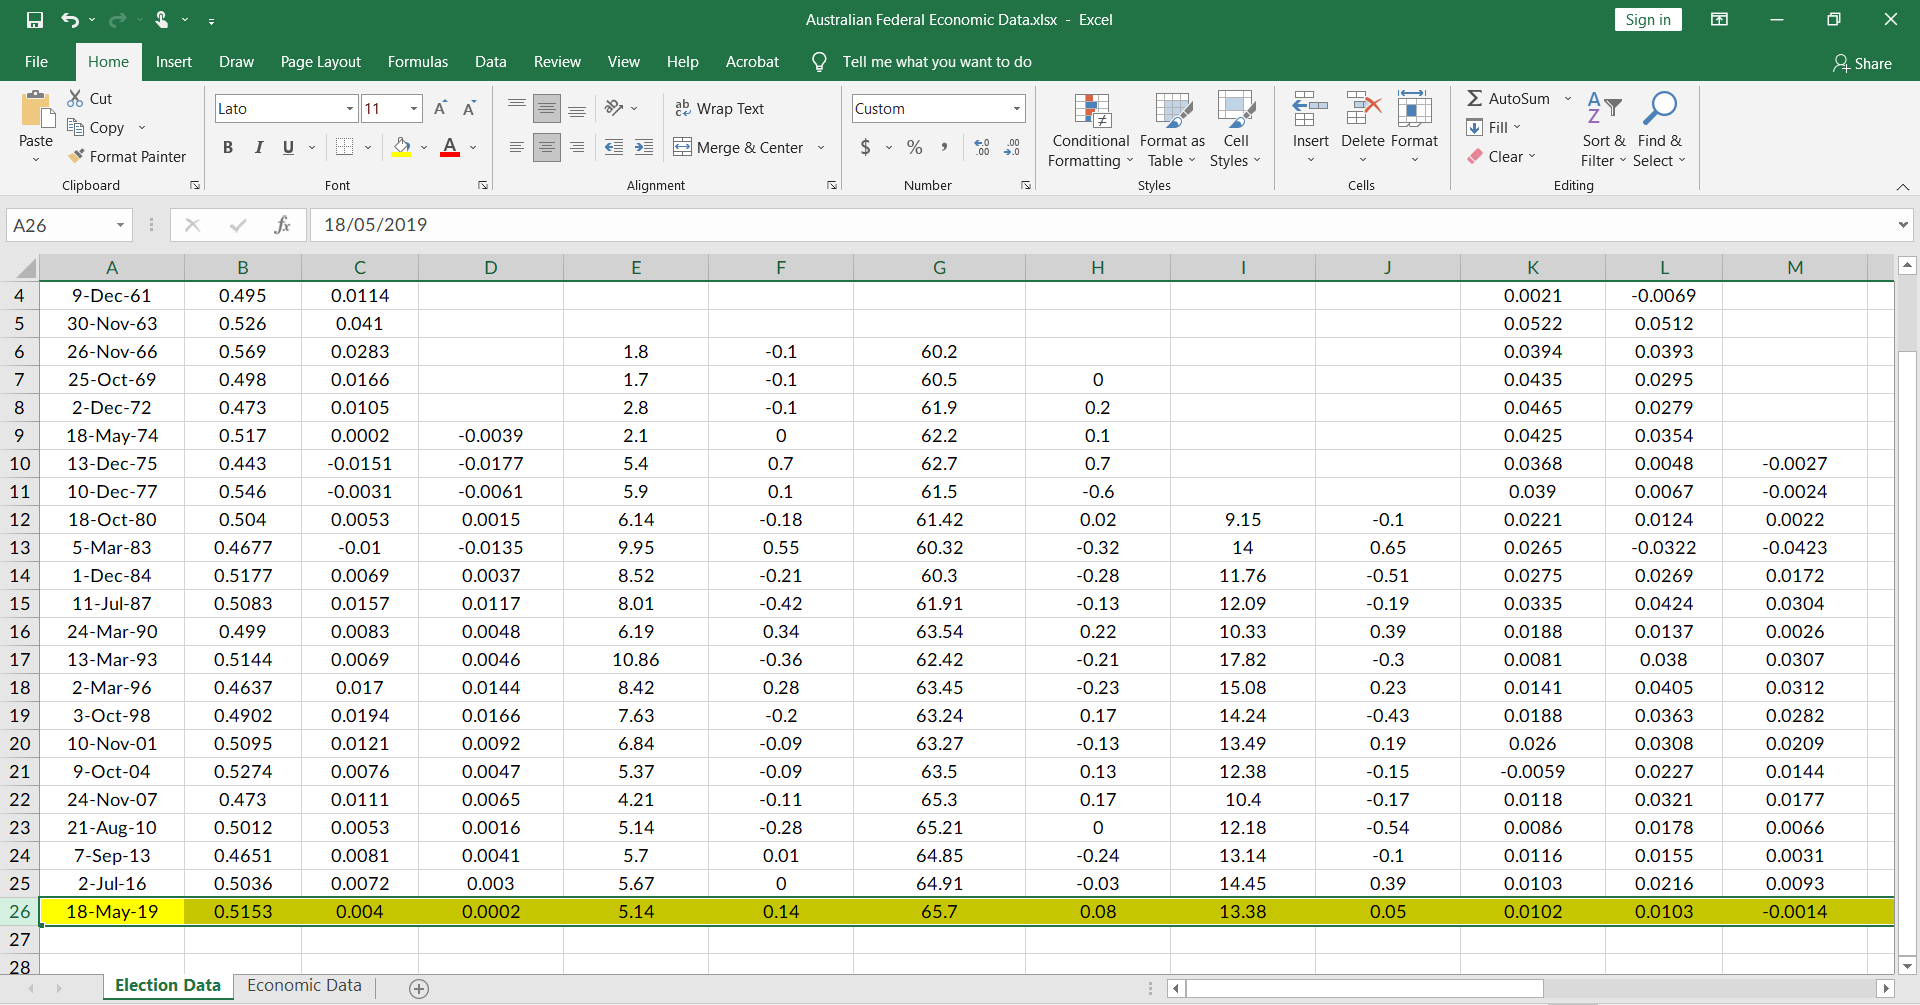
Step 1: Collect as much data as possible
To build a model, you need as much data as possible, right? Right! So first step, is to collect as much data as humanly possible.
Let’s say your theory is that the economy affects voting-intention. Good economy, more people vote for the government, bad economy, fewer people vote for the government. Clean, simple theory.
But what is “the economy”? Isn’t the economy a highly complex creature, with lots of different metrics, none of which capable of capturing the full picture of how people are doing financially? Which one are you meant to select to build your model?
To which I say: take them all. If one metric doesn’t correlate with voting intention, why, there’s nothing wrong with your theory – it just means that that metric doesn’t correspond to “the economy”! And since, y’know, no metric completely captures “the economy”, that means that the only path forward is to throw as many metrics as possible into your model’s training data! What could go possibly go wrong – you’re just trying to capture “the economy” in its fullest, after all!
Step 2: Curate your data
Now that you’ve got all that data, you have to curate it. And by curate, I mean cull data-points which, y’know, just don’t make any sense.
Like this – 1977. The Fraser Coalition government winning against Whitlam’s Labor a second time in a blowout, despite mediocre economic conditions at best. But that doesn’t have anything to do with the economy – that’s because Labor re-ran a PM who previously lost during a bad economy! Nothing like that is happening this time, so we should just toss out this data-point, right? Right! Let me just…
…there we go! Look at that R-squared value – so much higher already!
(If you’re worried someone might call you out for this, you might have to get a bit more creative by deleting data from before a certain point in time – e.g. deleting data from 1980 and prior. You might also have to come up with plausible post-hoc justifications for this – good examples include “the influence of the Democratic Labour Party”, “the lack of presence from the Australian Greens”, or “changes in methodology for estimating unemployment”. Then stick it home with some ominous-but-academic-sounding rationale like “makes applying conclusions from that era difficult” and you’re done! Don’t worry, this is just for your fellow academics, journalists will usually be impressed that you managed to look at elections from 1983 onwards.)
Oh, I forgot to mention. There’s a few numbers everyone cares about. R2, the higher the better, and p, the lower the better. Always keep in mind your model must have a p lower than 0.05 to get any attention, and that if you’re writing an academic paper, you have to call R2 “what share of the variance your model explains” or you might get written up in peer review. (If it’s high enough, you can call it “how well your model predicts election outcomes” later, in the popular press.)
Oh, and of course, how many elections your model can call correctly is another important metric – it’s the only one the people who might interview you will care about. Remember to pick your definition of “call” correctly. If your model does best on calling the eventual government – Labor or Coalition – then use that. If not, use some other factor – maybe it calls the 2-party-preferred winner most often, or maybe it calls the primary vote winner correctly, or maybe it calls the primary vote winner of (Coalition + DLP) vs (Labor + Greens) best. Pick the right definition to sell- uh, build your model!
However, do keep in mind that there are some elections you can’t cull. If you’re in Australia, that’s the 2019 federal election (you can also sell it as having gotten 1993 right). In the US, you at least need to keep 2020 in your model (and preferably 2016 as well). Your model is meant to out-perform those pesky polls, and that means you need to be able to say that it got the correct result for the elections polls didn’t do well at!
Step 3: Define your variables
By this point, you should be able to simply run your dataset through a linear regression and find the amazing results you were looking for. If not, here’s another tip – redefine your variables.
For example, change in unemployment in the final quarter leading up to the election. You all saw how amazing the jump in R2 was when I tossed out 1977, right? Well, what if I could show you how to get an even higher R2?
Simple. Like I said before, the reason why these variables aren’t correlating more strongly with your model has nothing to do with whether or not your theory is wrong – it’s because those variables don’t capture “the economy” well enough!
So – with unemployment change. Maybe increases in unemployment only really bite when the unemployment rate is high – otherwise people are optimistic about getting a job and so they don’t vote to toss the government out.
How high is “high” unemployment? Well, let’s say…4%. If that doesn’t work for your specific case, try different thresholds – 3%, 5% etc until you get the high R2 of your dreams. Just remember to use nice round numbers (or obvious thresholds – e.g. “the targeted unemployment rate by the RBA”) so those pesky academics don’t come around and question you on your choice of threshold.
So, let’s see what happens when I delete the unemployment-change data for unemployment rates below 4%…
Voila! Look at that stunning R2. How many election models can claim such an ability to “predict” election results? Final (within 7 days of the election) polls actually correlate with the final result at about R2 = 0.5858.
If you calculate last-election preference estimates for old polls (who usually used the less-accurate respondent-allocated method), the percentage of variance in election results (which is what R2 is) goes up to 0.6241. Our pollsters mostly use last-election preference estimates instead nowadays so this is the better comparison.
An average of final polls would be even better at R2 = 0.7706. The final polling average would also have “called” the correct winner (of the 2pp) correctly 13 of 17 times (76%), with the exceptions being 1980 (1.4% error), 1990 (0.7% error), 1993 (1.7% error) and 2019 (2.9% error).
Oh, and if you’re worried people might criticise you for over-complicated definitions, there’s always Step 2 – see if you can try and pretend you didn’t manage to find data from before certain time periods. I hear periods where the relevant bureaus changed their methodology for estimating certain figures (e.g. the 1978 change in estimating unemployment) are always good choices.
Step 4A: Running a big, big regression
And here’s where we put it all together! By this point, you should have a large dataset with lots of economic metrics (remember, if anyone asks – you need all those metrics to fully capture “the economy”), with various entries carefully culled to maximise how well your model, uh, “predicts” past elections.
At this point, all you really need to do is to plug it all into your favourite statistical software of choice – R, Excel, Stata etc – and just run a regression. Which regression? Well, you tell me – which one makes your model look bes- sorry, I meant best demonstrates your theory? There’s so many options – you could theorise change in GDP per capita has a quadratic relationship with “the economy”, or that voting-intention only changes when “the economy” is really good or really bad (cubic), or that partisanship means that a really good/bad economy doesn’t affect the vote much (logistic). Mix and match to get the best model possible!
For the purposes of demonstration here, though, I’m just going to run a simple linear regression through all the data we collected…

Look at that amazing model! It explains 99.97% of the variance in election results! (remember to call it “how accurate” or “how well the model predicts elections” when you’re interviewed by journalists) Don’t worry too much about the p-value being above 0.05 – that doesn’t really mean that your model isn’t statistically significant, it just means, uh, that your model is “highly suggestive of significance”, or that it demonstrates a “numerical increasing trend”. Use some of these phrases to snare unsuspecting readers into thinking your model actually says anything about the interaction between the economy and voting intention instead of being over-fit hacked-together garbage!
Always remember, the important part is getting published somewhere – anywhere. As long as it’s published, it’s very unlikely to be retracted and you can go onto all the popular press talking about your cool new model and rubbishing detractors as “thinking the economy doesn’t affect voter behaviour” or some such thing.
Besides, how could anyone doubt your model? Just look at this chart:
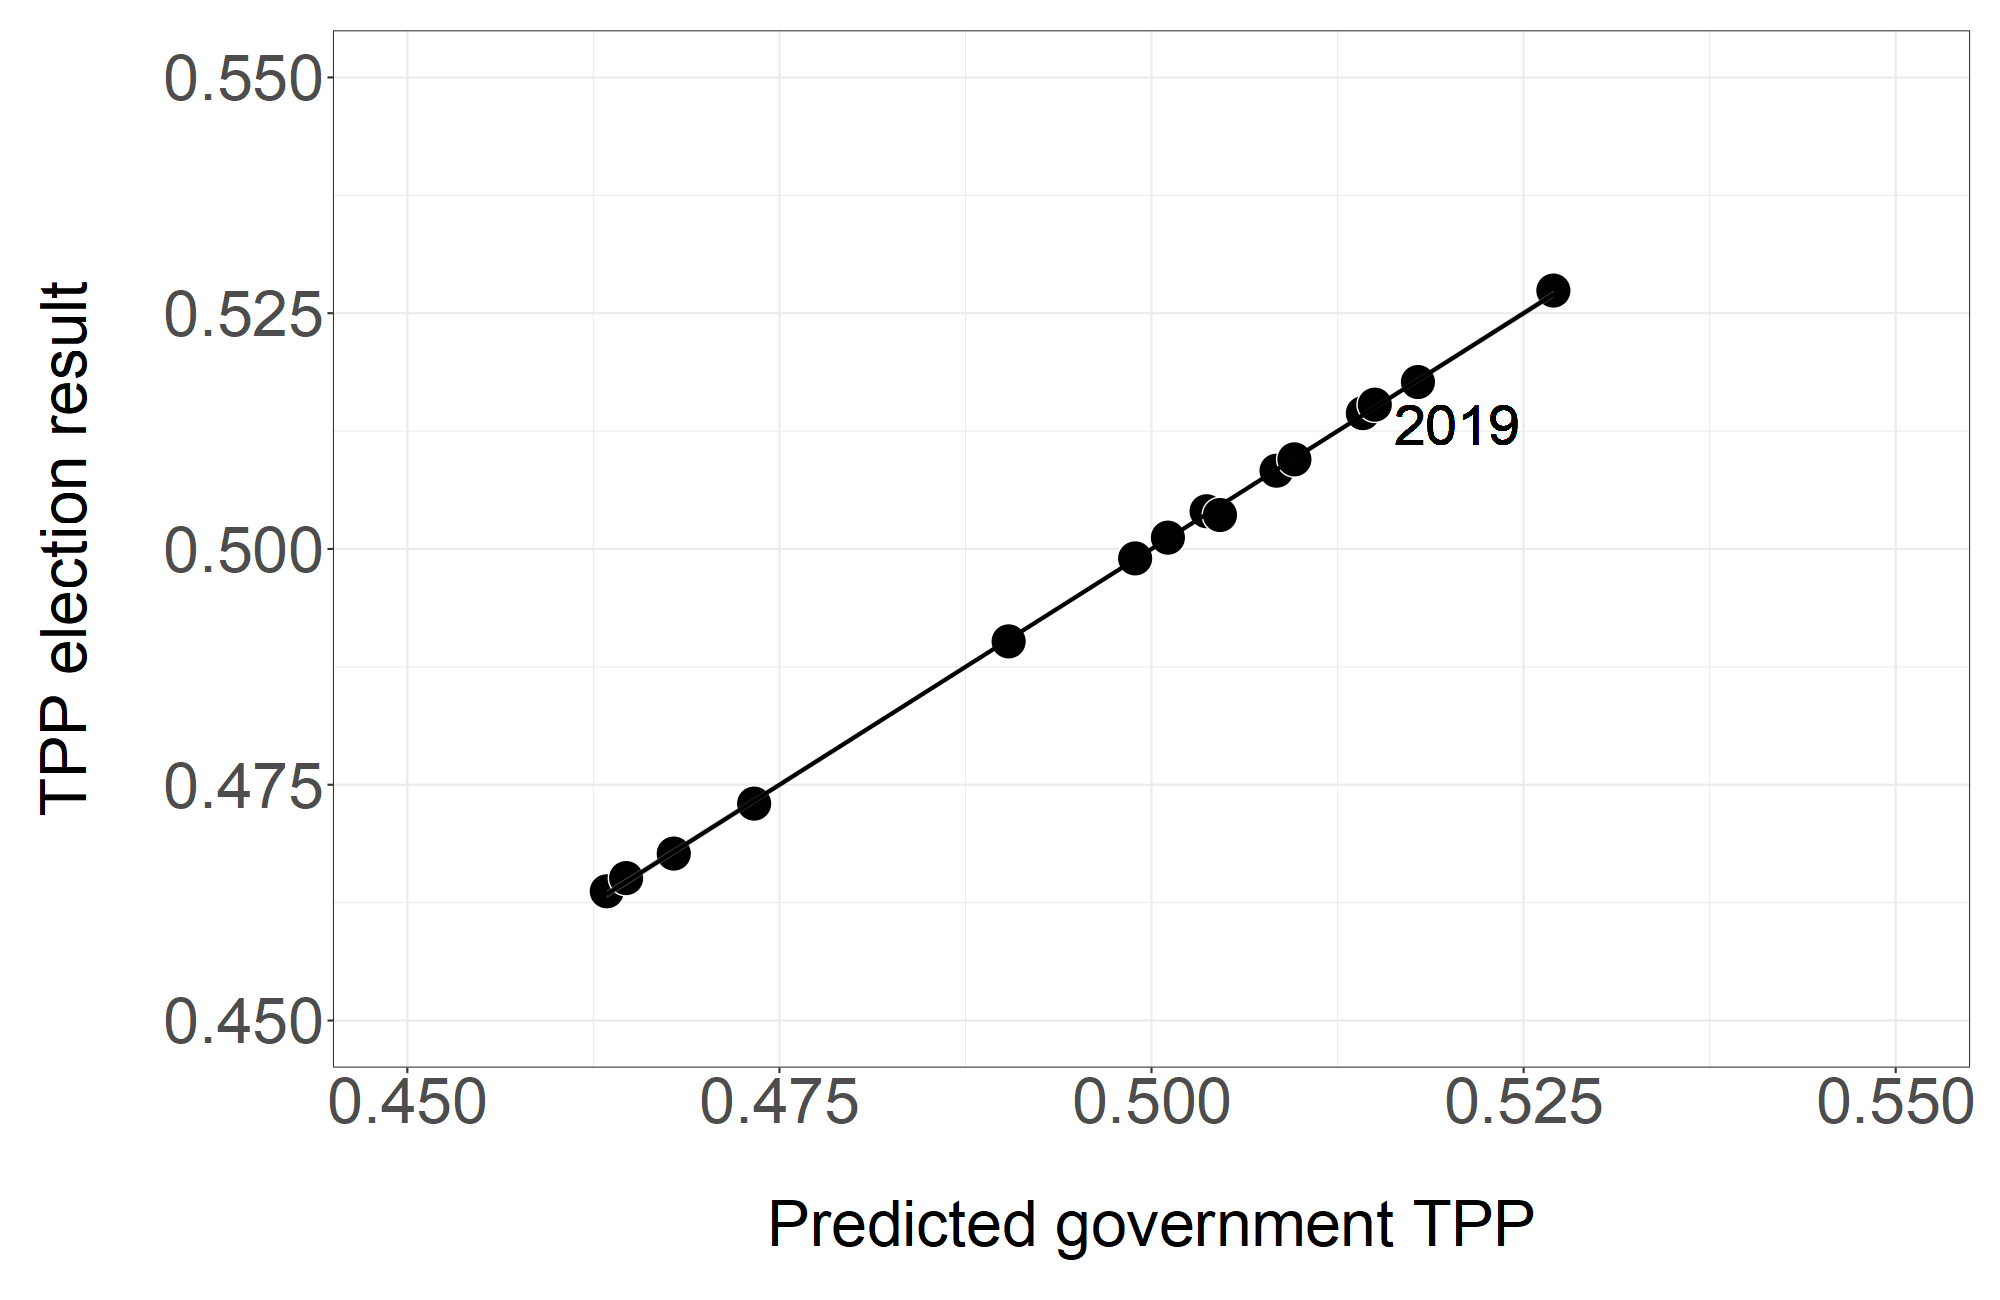
Just look at how well it predicts 2019! How could you question such a model?
Step 4B: Combinatorics and Interactions Are Your Friends
Unfortunately for all Highly-Accurate-Election-Model developers, there was something of a replication crisis lately in various sciences, which has made many journals and academics a lot more wary about models with a lot of variables and relatively few data-points. Yes, very sad.
Anyway. You can achieve models nearly as good (or equally good) without having to resort to using too many variables. How, you ask?
Well, remember all that data you collected in Step 1? There’s lots and lots of ways to measure how the economy is doing, right? Well, that means that there’s lots of different ways to combine two or more metrics into a model!
And with the power of Modern Computing, you can do so almost instantly! Just search up how to do loops in your favourite statistical software, and build a simple loop to run a statistical analysis on every single combination of two variables (or more, if you’re feeling adventurous). Then, pick the combination of variables which produces the highest R2 (or lowest p-value/Bayesian Information Criterion/lowest standard error etc etc) and you’re back in business!
Your model still not good enough for your taste? Then try Interactions! By claiming that two economic metrics have an interaction – say, “the effects of unemployment on incumbent voting intention are presumably greater during economic recessions”, you can further increase your model’s supposed accuracy without having to include new terms!
Just look at what Interactions can do for you:
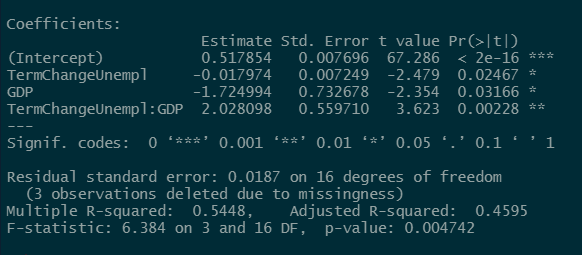
Amazing, isn’t it? Plus, every one of those terms now meets the p < 0.05 standard for statistical significance. Who can question you now?
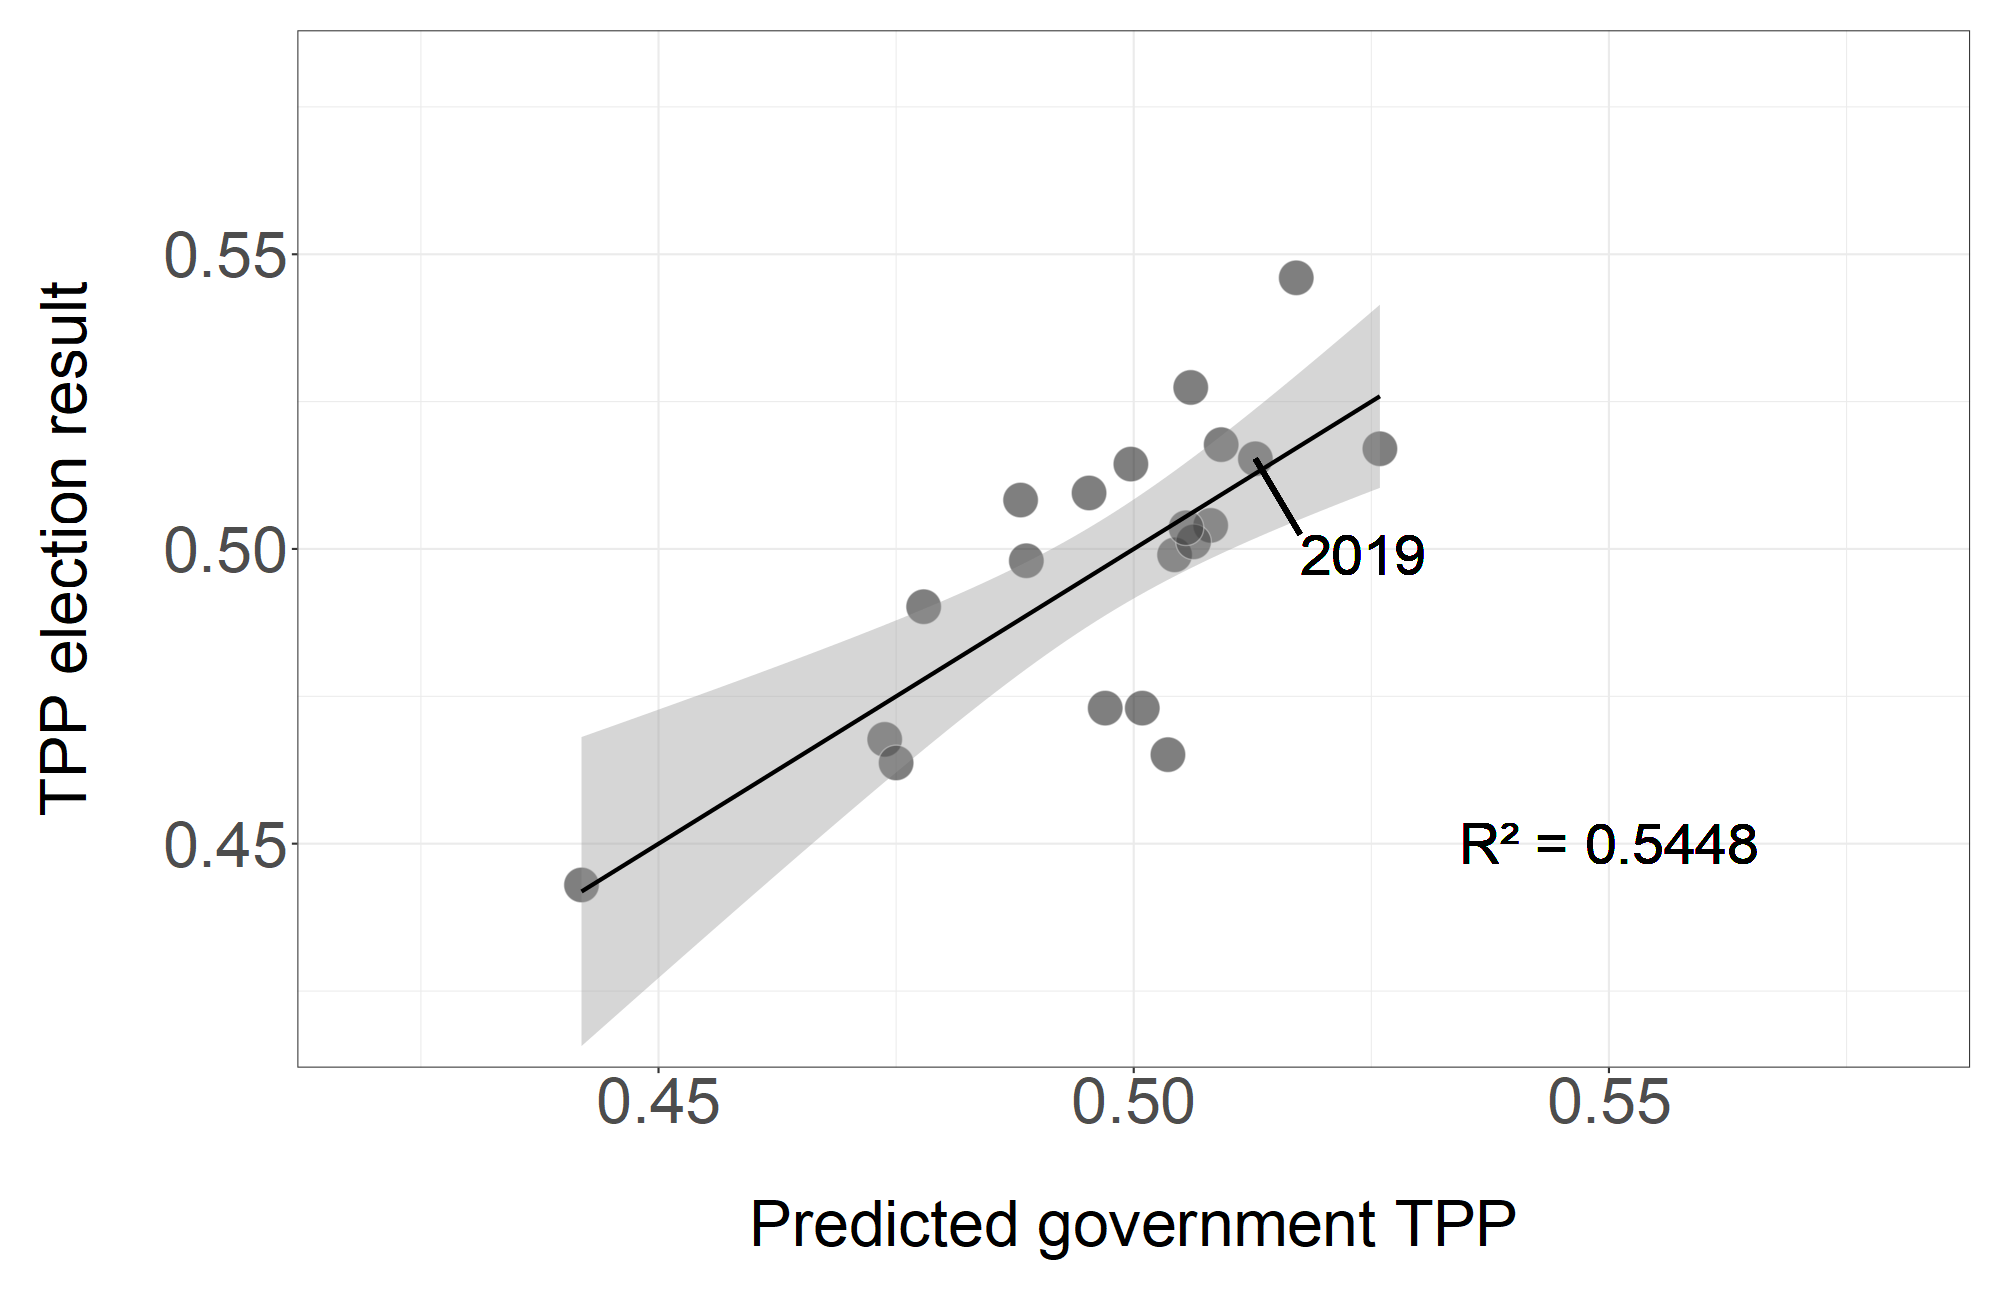
Still pretty good! Most importantly, it correctly “predicts” the 2019 result! Those pesky polls didn’t predict the 2019 result, did they? No, they must have a shy Tory bias or something like that – I heard that some experts conducted a review into the 2019 polls and found there was a skew to Labor in recent elections!
Modelling Debrief
Whew. I do hope that most people picked up the sarcasm in the above paragraphs and no one went out to develop their own Highly Accurate Election Model midway.
(And there really isn’t any systematic skew in Australian polling.)
First things first – what does the above mean? (if you’re familiar with over-fitting and the like, you can skip this bit by clicking here)
Basically, it’s my way of showing how easy it is to design a model which can be claimed to “predict” as many elections, or any specific election, that the author wants. Even with what seems to be a simple and hard-to-dispute theory like “the economy affects whether people vote to re-elect the government”, there are hundreds of ways to measure “the economy” and a bunch of ways to measure “how people vote” (seat count? 2-party-preferred? Primary votes?).
Due to sheer randomness, you’d expect some of those economic metrics to look like they correlate very strongly with the how-people-vote metric by sheer chance. And that’s what the models I proposed above exploit – by either putting lots of metrics into a model (so it can use random noise to “explain” any surprising elections) or finding random pairings of metrics which work well together. None of this produces a model which can predict elections any more than me shaking furniture parts in a box would produce furniture; it simply produces a model which is fitted very well to the existing data (hence the term “over-fit”) without it being able to actually predict future elections or even explain anything of value.
If I wanted to, I could easily have written it the other way around, by focusing on variables which don’t correlate with government electoral success (e.g. growth in GDP per-capita in the final-quarter up to the election, or the unemployment rate in the final quarter). I could have written a paper showing how none of these correlated to election results in Australia, found some research where the same metric correlated with election results in some other country and then written up a paper on how Australians just don’t vote on economic issues and speculate why that is. Same principle applies – lots of economic metrics, lots of countries.
(food for thought for any academics who happen to be reading this: is there any safeguard which could feasibly prevent me from getting something like the above into a journal? Pre-registration wouldn’t stop me – I could just run the code before writing the proposal; while lowering p-value thresholds to p < 0.01 also wouldn’t be much of a challenge)
Secondly, I think it’s important to mention that I do think the economy does have some impact on how Australians vote. The problem is that “the economy” is a very complex thing which is hard to capture in full with any one metric, while using multiple metrics opens up the problems I mentioned above regarding over-fitting. I’ll probably write a follow-up explaining which metrics are probably the best at capturing “the economy” at some point (Edit: that’s up here), but suffice to say that probably over a quarter of the variation in Australian federal election results can be explained by economic performance.
Thirdly, I should also make it very clear that I’m not targeting any one model or author or anything like that with this piece. As far as I know, Australia has yet to see the flood of over-fitted models which hit e.g. the USA, and I do hope that the replication crisis has sufficiently raised awareness of poor statistical practice that we never get such a flood.
That being said, we did just have one of the largest polling errors in many years here, and it’s pretty well known that quacks will start to pop up wherever modern medicine appears to fail. So take this as a pre-emptive, as something to keep in mind if such models ever start popping up in the media. Life – especially politics – can be very uncertain, and the ability to plot a nice line through a set of data does not translate into the ability to predict elections.
What is to be done?
Frankly, it may be best to ignore most articles in the popular press about models which can “predict” election results without the polls. Such models tend to be over-fit, or trained on very small numbers of elections, or both – and hence tend to be bad at predicting future elections (for which they don’t already have the result).
However, if you’re interested in reading about such models anyway, here are some things to think about: (they’re not enough on their own, not by a long shot, but hopefully they establish a sanity waterline)
- What do they claim to predict? Many such models will claim to predict some specific elections which were surprising to the media (the usual culprits of Trump and Brexit will usually show up, with Morrison 2019 probably joining them in Australia). But it’s important to keep in mind that distance from the pin – how close they got it – is much more important than whether they got the outcome right. A model which predicted Leave would win 60-40 is worse than one which predicted Remain would win 51-49 even though the former got the outcome “right” – if it’s 8 points out in that referendum, who knows how bad it’ll be at future elections.
Be especially wary of the models which make any claims around the Trump elections (2016 and 2020). It’s worth keeping in mind that Trump lost the popular vote both times, while models which claimed to have predicted a Trump win usually did so through predicting he’d win the popular vote.
In the Australian context, also be wary of any model which makes seat predictions, or attempts to convert vote predictions to seats without a detailed seat-by-seat breakdown. Until the 1970s, rural seats were allowed a smaller enrollment than they’re allowed today, which went some way to helping the Coalition stay in power in the Menzies years. Any model trained on those years will have something of a pro-Coalition (or pro-government) skew.
Furthermore, the pattern of which seats have incumbents can make a pretty big difference – incumbents are usually harder to toss out, and can help a government survive an otherwise adverse swing (see the 1998 election). All of this means that the pattern of which side can get more seats for a given vote tends to shift at every election; assuming that historical seat shares or vote-to-seat conversions will hold for the next election can be a risky affair. - Which elections are they tested on? Keep in mind that in Australia, we haven’t had a 2-party-preferred result greater than 54-46 in either direction since 1977. Any model which is only tested on 1980 or later excludes pretty much all the “outlier” elections and is much less robust (for mathematical reasons, excluding an outlier from an analysis tends to make the resultant model more confident and more likely to predict extreme results).
At minimum, a model should have been tested up until and including the 1977 election. Ideally, it would also have been tested on the 1969, 1972 and 1975 elections – those were all big landslides and excluding them from an analysis can distort the model’s outputs.
I would also recommend ignoring any reasons given for excluding certain elections or time-frames. The only acceptable reason should be “the data needed was not available back then” (and even that excuse brings up the valid question of “then how will we know if your model works in extraordinary elections such as landslides?”). As I demonstrated above, it is very easy to come up with plausible-sounding excuses for excluding certain time-frames; none of those excuses will change the fact that it was not tested in those circumstances and hence might break if it was applied to unusual circumstances (say, I don’t know, a pandemic? An economic situation in which unemployment rises but incomes also rise due to government support?). - How did they test their model? There is a very big difference between being able to draw a line through a group of points, and being able to actually predict what the next point will be.
Drawing a line (or doing a regression) through a group of points is (relatively) easy – when you do that, most of the points will be fairly close to the line:
However, that’s not the same thing as being able to predict what an unseen data-point will be. The better way to test a model is to “hide” some data from it, and get it to predict that data.
For example, the red line below was produced without having seen the “last” data-point:
If I put both the red and purple lines together on the same graph, you can see how the red line is further “out” for the unseen data-point:
Fancy names for this kind of testing include things like “leave one out cross validation”, which does the same thing with every data-point to estimate how accurate the model might be at predicting new data. - Does their model actually make sense? The kind of non-polling election models you hear about in the media are going to be disproportionately of the man-bites-dog kind – by which I mean they’re going to be optimised to be attention-grabbing one way or another. Apart from accuracy, another way to get attention is to write about counter-intuitive and shocking patterns – e.g. “model shows that government support tends to go down during periods of high GDP growth”.
But does this actually make any sense? Not “does the person writing about it have a plausible and authoritative sounding explanation” – anyone can spit out one of those (say “voters may be more likely to turn to incumbents during times of economic crisis…” and toss in “stability” somewhere), but does it seem reasonable?
Here’s an example from above:
TermChangeUnempl = annual average change in unemployment throughout the govt’s term
GDP = GDP growth rate in the quarter leading up to the election
TermChangeUnempl:GDP = TermChangeUnempl multiplied by the GDP term
The “Estimate” column is basically what we would expect to change given a change in each term; so for example if TermChangeUnempl is -1 (i.e. the unemployment rate went down by 1% on average each year, throughout the government’s term) then we would expect the government’s 2-party-preferred to go up by 0.017974 or 1.8%.
Notice the “Estimate” for the GDP term. It’s negative. In other words, this model expects that if people get more jobs in a government’s term (TermChangeUnempl is negative), the government’s vote goes up – makes sense so far, standard voters-reward-govt-for-good-economy theory. But then it also expects the government vote to go down if GDP increases in the final quarter? Huh?
(Left-wing media: Model shows that people don’t like it when dignified employment is sacrificed at the altar of economic growth)
(Right-wing media: Our politicians need to stop taking in new migrants to grow the economy and focus on jobs for those of us already here)
It makes absolutely no sense. And the interaction term – the fact that it’s positive basically says that if the economy grows but more people are unemployed or if the economy shrinks and fewer people are unemployed, then the government’s good to go; but if the economy grows and fewer people are unemployed, then…the government’s going to get tossed out?
It’s worthwhile to try and interrogate models and the people who build them over how they reach the conclusions they do. While counter-intuitive results are sometimes true, you usually need a heck of a lot of evidence to nail them down and the replication crisis in psychology has demonstrated that man-bites-dog type papers often end up being refuted down the line. - Run away screaming from any model which primarily relies on analysis of social media
I don’t doubt that social media is very important in shaping how voters perceive parties, policies and leaders. However, there’s a few very important things to keep in mind:
Firstly, social media has only really been around for about five Australian federal elections. That is nowhere near enough of a sample size to build any kind of model around, let alone testing and validation.
Secondly, social media users have seen massive shifts in that time-frame. Facebook, for example, has shifted towards an older demographic while younger generations have moved towards newer platforms like Snapchat. Furthermore, a lot more Australians are on social media than they were in the past, which may shift the kinds of things discussed in the various platforms.
Thirdly, social media content has also seen massive shifts. Many social media platforms started out as free speech absolutists, then haltingly began to move to curb misinformation on their sites. While it’s yet to be seen if there will be crackdowns on political advertising or misleading information (as Labor has complained about after 2019), it’s not implausible to think that bans/suspensions of many figures from various platforms will have an impact on the mix of content on said platforms.
Finally, social media users tend to be systematically different from regular voters. If you’re reading about politics on a social media platform, you’re almost certainly much more politically engaged than the average Aussie, which has flow-on effects on how you vote. Various platforms also tend to have various skews – Twitter, for example tends to skew pretty left.
It’s entirely possible that there might be ways to adjust for all of these confounders, but given the small number of elections conducted with mass participation on social media, many ways of doing so are going to be very susceptible to over-fitting and/or insufficient adjustment for shifts in the social media landscape. I don’t doubt that at some point, social media based models may well become a valuable tool for election forecasting, but they will probably need a few election cycles to iron out their kinks and validate their predictions before they do so.
If you’ve read this far, I hope I’ve demonstrated to you a fairly simple fact of statistics – given enough data, it is possible to build any kind of model with supposedly supernatural accuracy in “predicting” past elections without necessarily being able to predict future elections. Furthermore, it is very easy to generate plausible-sounding excuses for why a model should work the way it was set up without actually building an accurate model at all. Reality has this annoying tendency to not respect p < 0.05 or “called (high number) of elections correctly” going forward, and there’s a very big difference between being able to “call” elections you already know the results of and being able to predict elections that haven’t happened yet.
Hence – if someone comes to you, or gets on the media claiming the polls are wrong and they know exactly how the next election will go, I recommend you only listen to them if they can prove they’re a time traveller.
Otherwise, they’re either a hack or a quack. Treat them as such.