One of the many interesting political alternate histories people ponder is the possibility of a 1992 win by independent Ross Perot, upsetting the two-party system. From an early 21st century lens, however, the idea that a candidate from outside the Democrat-Republican duopoly could win the Presidency sounds completely ludicrous – a video released a week ago exploring the possibility of a Perot win by the YouTube channel AlternateHistoryHub describes it as “incredibly unlikely” and notes that “by the way the United States runs its system, good luck ever having a third party actually win”. While Rebekah is planning her own alternate history piece on what might have happened had Perot won the Electoral College without winning a plurality (i.e. the most, not necessarily a majority) of the popular vote (read here), here I intend to explore what the data says about how Perot could have won the Presidency, and provide a potential path for this happening.
While the winner-take-all system currently used in the US Electoral College does discourage third-party and independent candidates from winning, such a challenge is more one of co-ordination than of any actual mechanism in the Electoral College. As a candidate has to win the most votes in a state/jurisdiction to win Electoral College votes (EVs), a minor party/independent candidate has to persuade voters that they are indeed able to win whole states before voters will consider voting for them, for fear of otherwise wasting their vote. (Although it is possible to function as a protest candidate for voters dissatisfied with the two major parties, this is very unlikely to win enough voters for a plurality)
As a result, fewer voters are willing to consider candidates other than the Democrat/Republican, reducing such candidates’ share of the vote and making it harder for them to win, causing even fewer voters to consider them in a downward spiral, a phenomenon known as Duverger’s Law. Hence, the winner-take-all system used by all jurisdictions in the US Electoral College does make it harder for candidates outside the Democrat/Republican duopoly to win votes, but as we shall see below, it does not necessarily preclude a sufficiently popular third-party candidate from winning.
Perot’s 1992 campaign – what actually happened
As polling, news clippings and discussion from the 1992 US Presidential election show, for most of the campaign, Ross Perot was indeed considered to be a viable candidate to win the Presidency. For most of June, pluralities of voters told pollsters they intended to vote for him, a share which might have been underestimated considering that the final polls in the 1992 election underestimated his support by 5%. He was the only candidate (as of 2020) to get to debate both major-party candidates in a three-way presidential debate, turning his focus on the deficit into a key issue for both major party candidates in the process and solidifying his position as a viable candidate in voters’ minds.
Then, a combination of campaign chaos and slippage in the polls resulted in Ross Perot pulling out of the campaign, badly damaging his chances of ever winning the Presidency as a sizeable chunk of his supporters felt deserted and negative views of him rose. Upon his reentry into the race, polls showed that far from the 20 ~ 40% support he once commanded, Perot started out with about 10% of the vote and ended up with 19% on election day – a highly credible third-party performance but well short of the ~30% support he once commanded.
So how could Perot have won?
The easy answer lies in the polling mentioned above – don’t drop out! Perot’s decision to drop out of the race at the end of June was easily the largest single factor in the drop-off in support seen from his peak of 39% to the much smaller 10% he commanded when he re-entered the race, and plausibly cost him about 5 to 10% of his support (in absolute terms), depending on which pre-dropout polls you look at.
However, as mentioned above, Perot was already declining before he dropped out of the race, and minor party/independent candidates tend to underperform their early polling (a point I will return to later), leading to doubts he could have won even if he had stayed in the race. A few other factors would likely have to change for Perot to be assured of victory:
- Bill Clinton fails to improve on his early 1992 polling. Clinton was polling quite badly in early 1992 polling, being stuck under 30% until Ross Perot’s July dropout (with the exception of a bump around the time when the Democratic National Convention was held – which was very likely to be temporary). While Clinton may have gained momentum with that convention bounce and overtaken both Bush and Perot, there are a variety of factors which could have prevented that from happening, ranging from Clinton’s own scandals (e.g. what if Hillary hadn’t stuck by her husband during the Gennifer Flowers scandal?) to the possibility of Clinton being unable to unify his party. Perot was to the left of Clinton on most key social issues, such as abortion, same-sex marriage, gun control as well as some economic issues such as taxes for the wealthy, and could have peeled off parts of the socially liberal wing of the Democratic Party. Furthermore, in polling of both the 1992 and 1996 elections, voting intention for Perot was much more strongly correlated with voting intention for Clinton than the Republican Although some of the data in the Clinton/Perot graph was taken from before the 1992 DNC (and thus before Clinton officially consolidated the party behind him), excluding that data would still result in the same conclusion, as Perot’s re-entry into the race hurt Clinton more than it did Bush (Clinton dropped from around 50% to 41 ~ 44%, while voting intention for Bush continued to hover around 30%).
Even in the 1996 election, Perot’s decline from his peak at the start of the race saw Clinton’s vote increase far more than Dole’s (Clinton went from 43 ~ 47% to 51 ~ 52%, while Dole went from 39% to 35% ~ 41%), which together suggest that a large chunk of Perot voters would have preferred Clinton over the Republican. :

Scatterplot of Clinton versus Perot’s vote in polls of the 1992 and 1996 election. 
Scatterplot of Republican (Bush/Dole) versus Perot’s vote in polls of the 1992 and 1996 election.
- Perot runs a tighter, more professional campaign. As we note above, the campaign chaos was one of the reasons Perot opted to drop out in the first place. Perot’s campaign had some of the best political and advertising talent of the era, ranging from the chairman who helped a little-known governor of Georgia rise to the Presidency (Jimmy Carter) to the advertiser who worked on Ronald Reagan’s wildly successful “It’s Morning in America” campaign (Hal Riney). However, such people often felt sidelined, disregarded by Perot or in the case of Riney, sacked entirely.
Such chaos was likely damaging to the Perot campaign, which, as a third-party campaign, needed to ensure they avoided any suggestion of incompetence or inability to win for fear of entering the classic third-party death spiral. A more unified, co-ordinated campaign could have avoided this chaos, while a strong advertising arm could have helped the campaign rebound after the Democratic convention bounce.
It should be noted that Perot’s my-way-or-the-highway style may have made it harder for such a change to have happened. Still, as the example of Californian governor Schwarzenegger shows, the prospect of defeat can definitely inspire people to make changes to their strategies. - Perot’s campaign focuses on slightly different issues. Obviously, it’s very unlikely that Perot suddenly pivots to a completely different set of issues instead of his primary focus on economic issues such as the deficit. However, with the benefit of 2020 hindsight, we can see that some issues like the effects of trade agreements are bigger vote-winners than others such as the deficit or the national debt. While the national debt issue probably produced the one of the largest gaffes for HW Bush of the election, as Trump’s performance in the Upper Midwest shows, the issue of job losses due to free trade agreements is a highly salient issue for many voters.
With Perot’s existing popularity, a shift from a primary focus on the deficit to a focus on the harm NAFTA might do to USA manufacturing (especially in the midst of recession) would likely net him votes from economically depressed communities, especially former manufacturing hubs in the Upper Midwest where Perot performed about the same as he did nationally. Perot won 18.9% of the vote nationally. In Upper Midwestern states, he won between 21.5% (Wisconsin) to 16.6% of the vote (Illinois), with the four states where he polled closest to his national vote share all being Upper Midwestern states (Indiana, Michigan, Iowa, Pennsylvania).
Objection!
These are some objections I’ve found to the possibility of a Perot win, or some of the modelling decisions made. Note that this does not mean I think a Perot win was unlikely; I merely think that with slightly different conditions it was highly plausible and certainly the best shot any third-party candidate has had since Roosevelt’s 1912 challenge.
- Polled third-party voting intention tends to decline as the election progresses, and thus Perot’s early leads should not be considered representative of the final result. This is definitely true, and I don’t dispute that this has happened for most if not all third-party candidates. However, the problem with assuming this would definitely have applied to Perot is the fact that we don’t have any other polling of Presidential elections where the third-party candidate actually outpolls one or both major party candidates.
Most of the time, a vote for a third-party candidate is viewed as a protest vote against one or both of the major parties, as the third-party is viewed as unlikely to win. We really don’t have any examples of how the polling of a third-party changes over the course of a Presidential election in which the third-party is viewed as plausible or likely to win. - Perot couldn’t have won even if he didn’t drop out. This is a highly unrealistic and overconfident view of the race. Perot’s dropout of the race saw his net-favourables (% of people with a favourable opinion of Perot – % of people with an unfavourable opinion of Perot) go from +20 to -40 and his poll numbers drop from 30% to 8% on his re-entry into the race. Without this event, it’s entirely plausible Perot could have won, especially when you consider that his dropping out meant that people would consider him a long-shot, third-party candidate on his re-entry (and hence many would avoid voting for him for fear of wasting their vote).
Even with those constraints, in our timeline, Perot managed to recover with an excellent performance in the Presidential debates and finish with 14% in the final polls (which he proceeded to outperform by 5% in the final result). Given that surveys suggested a large chunk of the electorate (36%) was interested or willing to vote for Perot if they thought he could win, this seems to suggest that had Perot remained in the race and remained competitive (instead of dropping out and returning with just 8% of respondents intending to vote for him), he could have come close to winning if not outright winning the election.
I’ll note that the survey cited above probably overestimates the proportion of people who would have voted for Perot if they thought he could win (especially considering they only found 4% of respondents who said they did vote for Perot). However, as my analyses below demonstrate, Perot only needed an additional 10 – 15% of the electorate to switch their votes to him for victory. Even if the true share of the electorate who would have voted for Perot had he been perceived as a viable candidate was just half of what the survey found, it would still have been enough for him to win. In that light, claiming that there was no way Perot could have won had he not dropped out, when this single event badly damaged perceptions of Perot and branded him with clear third-party candidate status seems patently ridiculous.
(note that this doesn’t necessarily mean I think a Perot win had he not dropped out was likely, I just think it’s plausible when considering the evidence that that single event badly damaged his standing in our timeline. It’s also important to exercise a degree of epistemic humility when thinking about what might have been different, had a key event changed; the claim that Perot could not have won even if he hadn’t dropped out is highly overconfident.) - Didn’t Ross Perot cost George HW Bush re-election? Why do you assume that most of his votes would have come from Clinton? This is a longstanding myth about the 1992 election, that the Perot campaign’s conservative economic message primarily drew votes away from Bush and helped to split the vote. While it’s not implausible that Perot’s campaign may have damaged Bush in its messaging, the idea that Perot voters were primarily Bush voters has been something which has been refuted repeatedly by a variety of sources, ranging from exit polls showing an even split to studies suggesting that Perot’s presence in the race actually reduced Clinton’s margin over Bush.
Additionally, as we note in this article, Perot voting intention is strongly negatively correlated with Clinton voting intention in polls, while being only weakly negatively correlated with Bush/Dole voting intention. Furthermore, in both 1992 and 1996, where Perot outperformed his polls, Clinton underperformed by nearly the same amount both times, providing further evidence for the idea that there are at least the same number of, if not more, Clinton-Perot voters than Bush-Perot voters. As there isn’t any polling showing Clinton ahead when Perot is at 30+% of the vote, and we would prefer to base our simulations in some kind of real-world data, our simulations primarily assume Perot drew more votes from Clinton than Bush.
(Obviously, polling on its own is not conclusive given the possibility of polling error; however when taken together with other data does point to the same conclusion).
What a Perot win might have looked like
Before we go through the scenarios, a little groundwork:
- For the scenarios here, we mostly try to base the vote shares we use on polling data. In most polls with Perot in a strong position (>30% of the vote), Clinton usually does worse, with Bush only losing a small share of his vote. Hence, here, the simulated maps are based off the assumption that most of Perot’s gains would come at Clinton’s cost.
- We also present two possible models of how a popular vote share might translate into state-by-state results: We considered developing a model where Perot would make fewer gains in states where he was doing better than average, however, even in Perot’s best state (Maine), only 30% of voters voted for him, meaning that it is unlikely that Perot was reaching the point where he would make fewer gains in Perot-leaning states. Furthermore, for the purposes of this article, we didn’t give Perot a very large share of the vote and hence we felt it was unnecessary to build a model which would account for what might happen if Perot started approaching e.g. 70+% of the vote in states.
- This basically takes the 1992 results for every single state + D.C. and adds or subtracts the same vote % to each e.g. if Perot gains 5% nationally, this model assumes he also gains 5% in every state. This is often used when modelling two-party elections.
Uniform swing models usually provide a fairly accurate estimate of the seat/EV totals when given a particular swing (change in vote %) – barring significant realignment, errors on one side (e.g. Florida turning more Republican in 2020 despite the national popular vote becoming more Democratic) often get cancelled out by errors on the other (e.g. Arizona and Georgia becoming more Democratic-leaning relative to the nation).
However, it may not be entirely accurate in modelling a three-way election, especially one where the candidate has no prior electoral presence and whose vote tends to concentrate in certain regions. - This model assumes that, if Perot gained in the popular vote, it’s likely that more of these gains are going to be concentrated in states/regions where he was already doing better than average.
Part of this is the fact that some states/regions (e.g. Maine, Alaska) are more hospitable to third-party candidates regardless of ideology, making it easier for him to make gains there, while part of it is also due to inelasticity in heavily Democratic/Republican states (in particular, places like Southern states or Washington, D.C.).
However, as we don’t have any data on how popular vote gains for Perot would be distributed, we can’t be certain to what extent this effect applies, or if it does apply at all.
The uniform model has the advantage of simplicity; however it can produce unlikely results such as Perot winning 18% of the vote in the overwhelmingly-Democratic District of Columbia (keep in mind he won 18.9% nationally in our actual 1992 election). The elastic model avoids such results but relies on an assumption which may not be accurate (or may be over/under-estimated), and is likely to break down if Perot wins a sufficiently high/low share of the vote.
A simple simulator for both models can be found here (scroll down to the row labelled “New” and enter in new popular vote figures for the candidates).
- This basically takes the 1992 results for every single state + D.C. and adds or subtracts the same vote % to each e.g. if Perot gains 5% nationally, this model assumes he also gains 5% in every state. This is often used when modelling two-party elections.
In the simulations below, states won by HW Bush are coloured red, states won by Bill Clinton are coloured blue, and states won by Perot are coloured purple (for the purple used by the Reform Party he set up to contest the 1996 election).
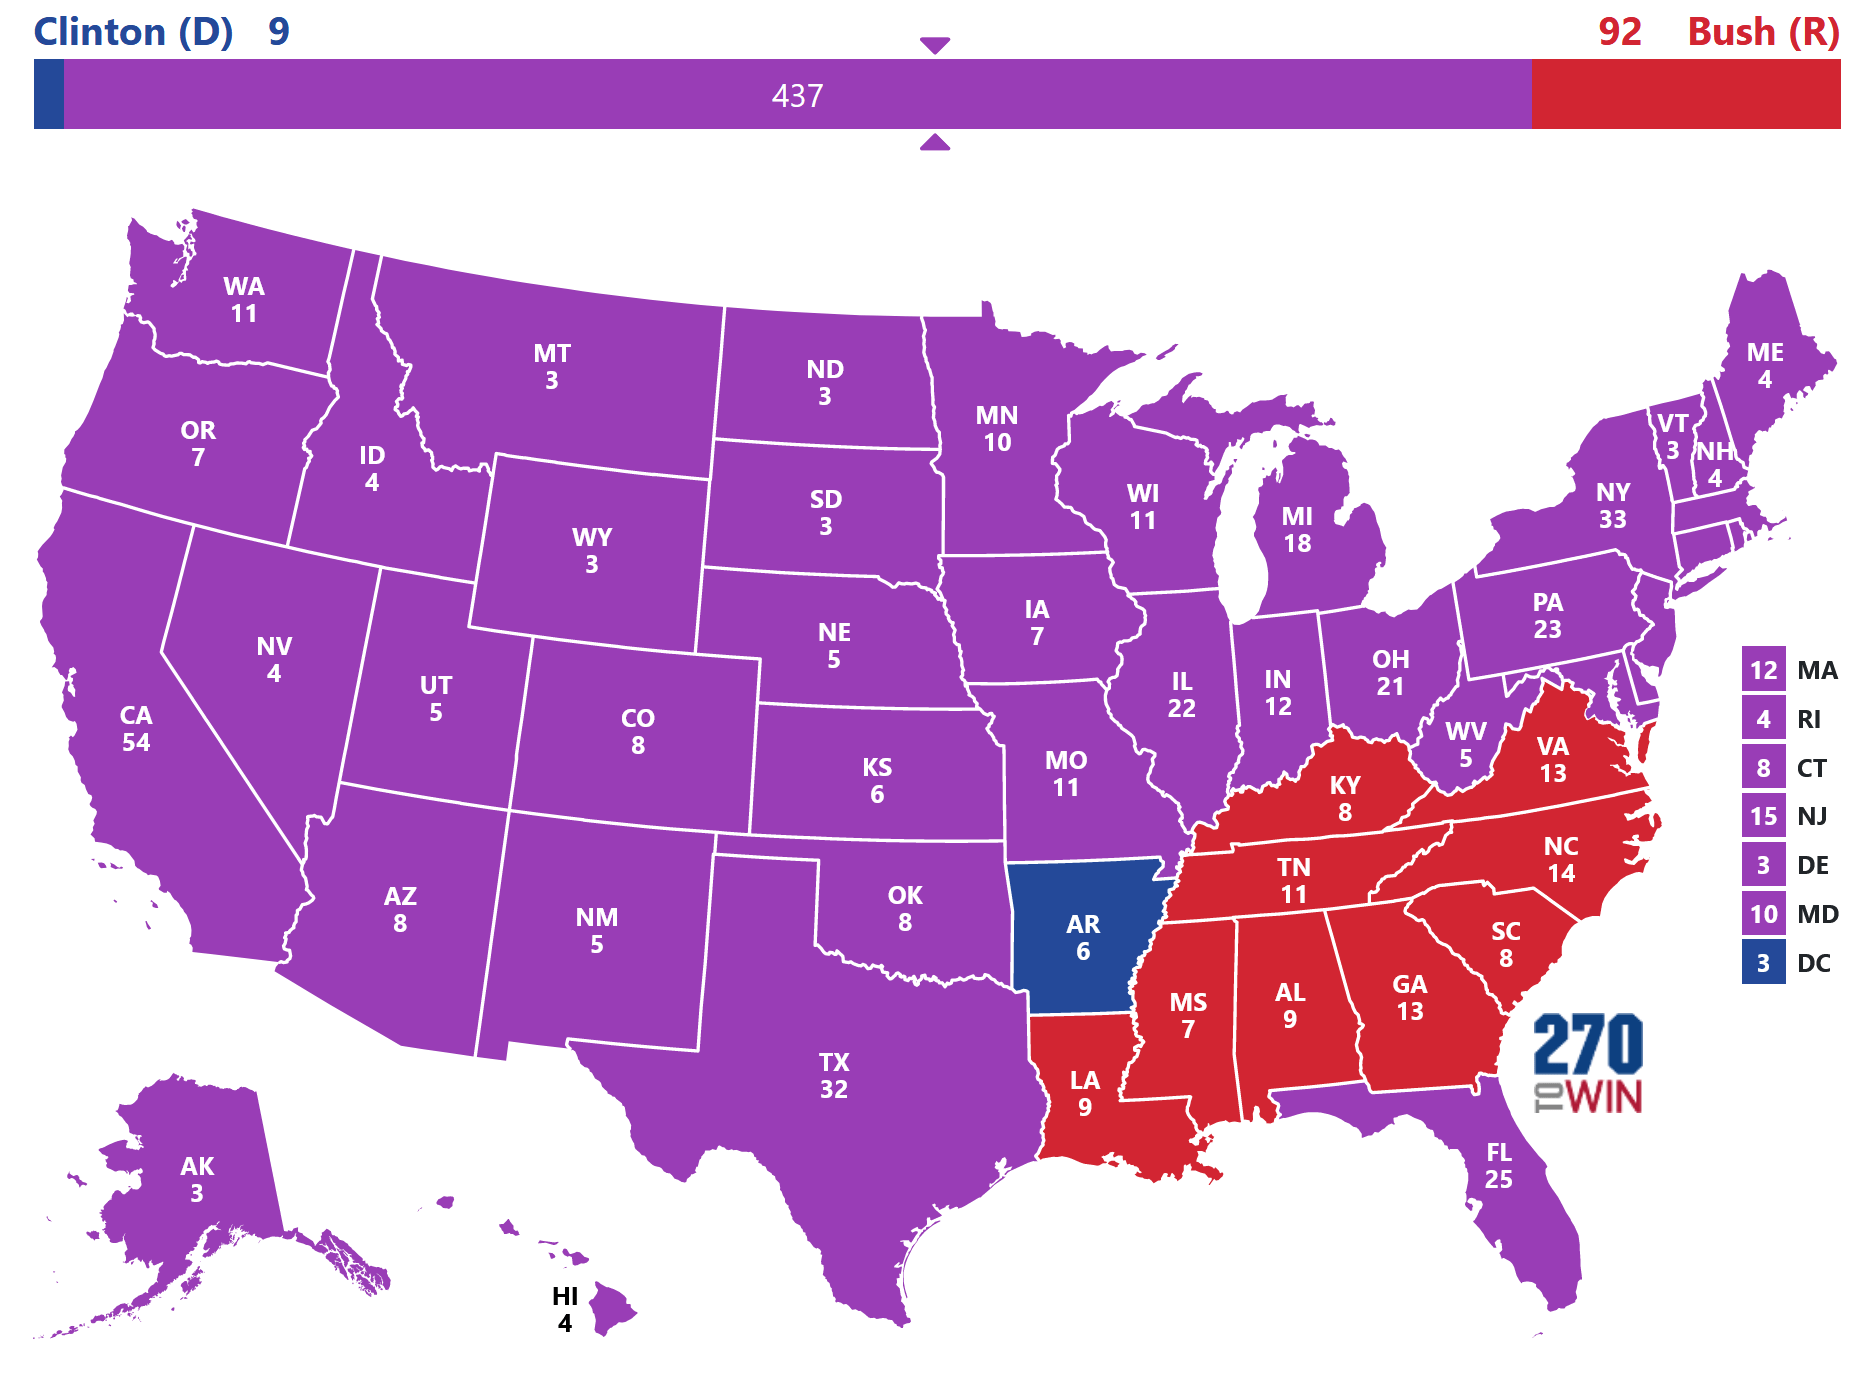
In the data we sourced, at his peak, Perot was pretty far ahead at 39%, with HW Bush at 31% and Clinton at 25%, with 5% undecided.
While this is plausibly the result of Bill Clinton’s poor name recognition at the time and undecided voters telling pollsters they would vote for the third-party candidate, what if Perot had managed to achieve such a result on election day?
Here, we reallocate undecided voters as follows:
- All other candidates combined gain 1%, not too far off from their actual 1992 total of 0.64%.
- Clinton gains 2%, as in the actual 1992 election he gained the most from here on out.
- HW Bush and Perot both gain 1% each.
In the electoral system used in basically all states to select electors for the Electoral College, the winner is chosen not by majority (50% + 1), but by plurality (whoever wins the most votes, even if they only have a minority of the vote).
This allows Perot, with a fairly efficiently-configured coalition, to win the Electoral College in a landslide with just 40% of the vote:
Uniform swing model:
Elastic swing model:
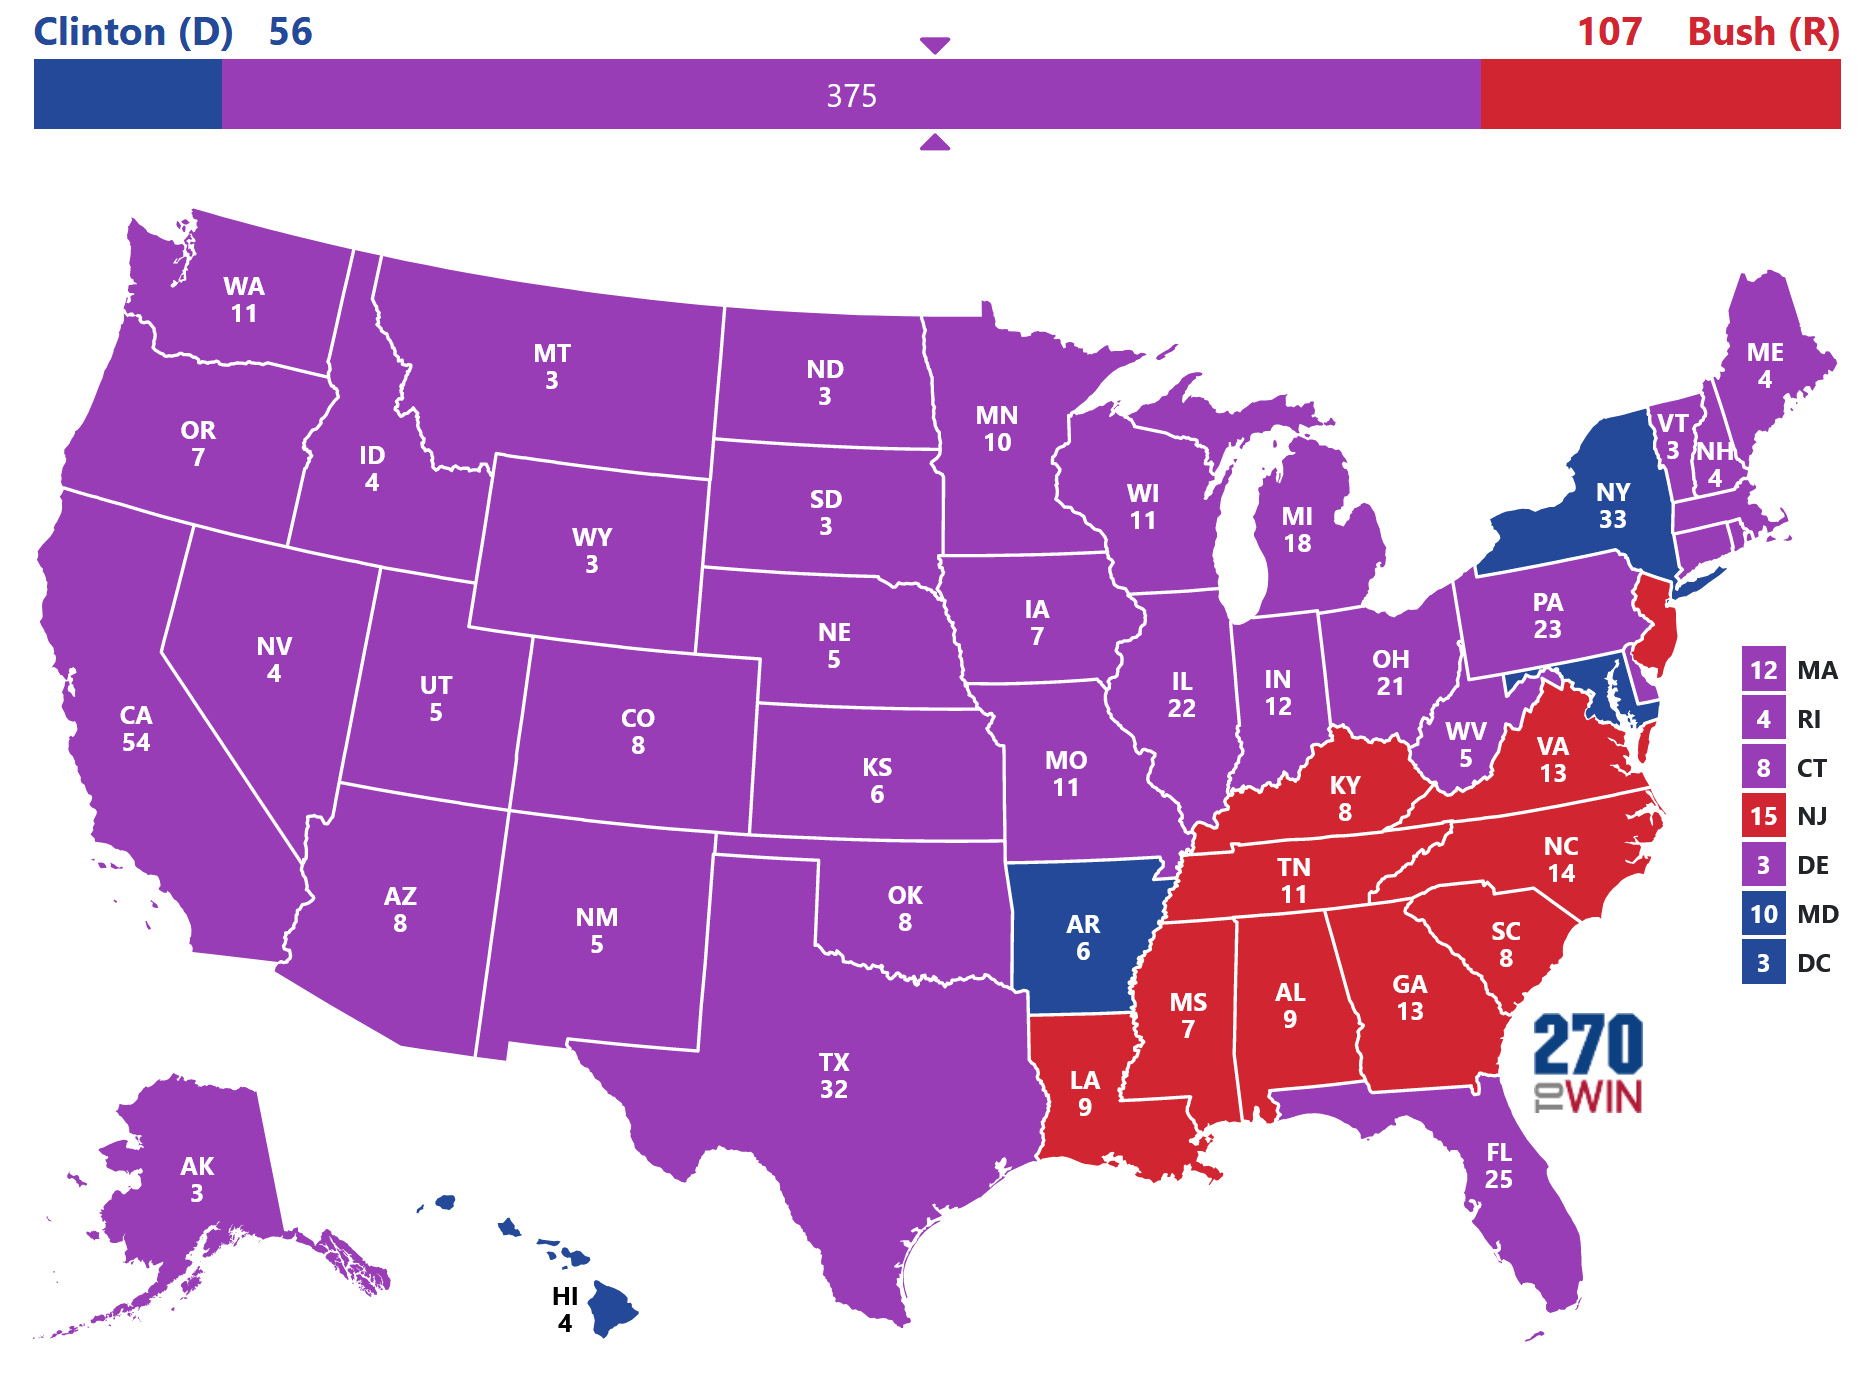
If Perot’s gains are distributed evenly across the nation, Clinton gets obliterated in the Electoral College with just 9 EVs. In a situation where more of Perot’s gains are concentrated in states he did well in during the 1992 election, Perot still wins an Electoral College landslide with about the same number of EVs as Clinton did in the actual 1992 election.
One other thing to note here is how much Perot’s appeal is somewhat more concentrated in Democratic-leaning regions (Northeast and West Coast) versus Republican-leaning regions (only in the Interior West does Perot perform well, while he underperforms in the South despite being a Southerner).
This casts further doubt on the notion that Perot drew votes away from Bush instead of Clinton, although it is not conclusive on its own.
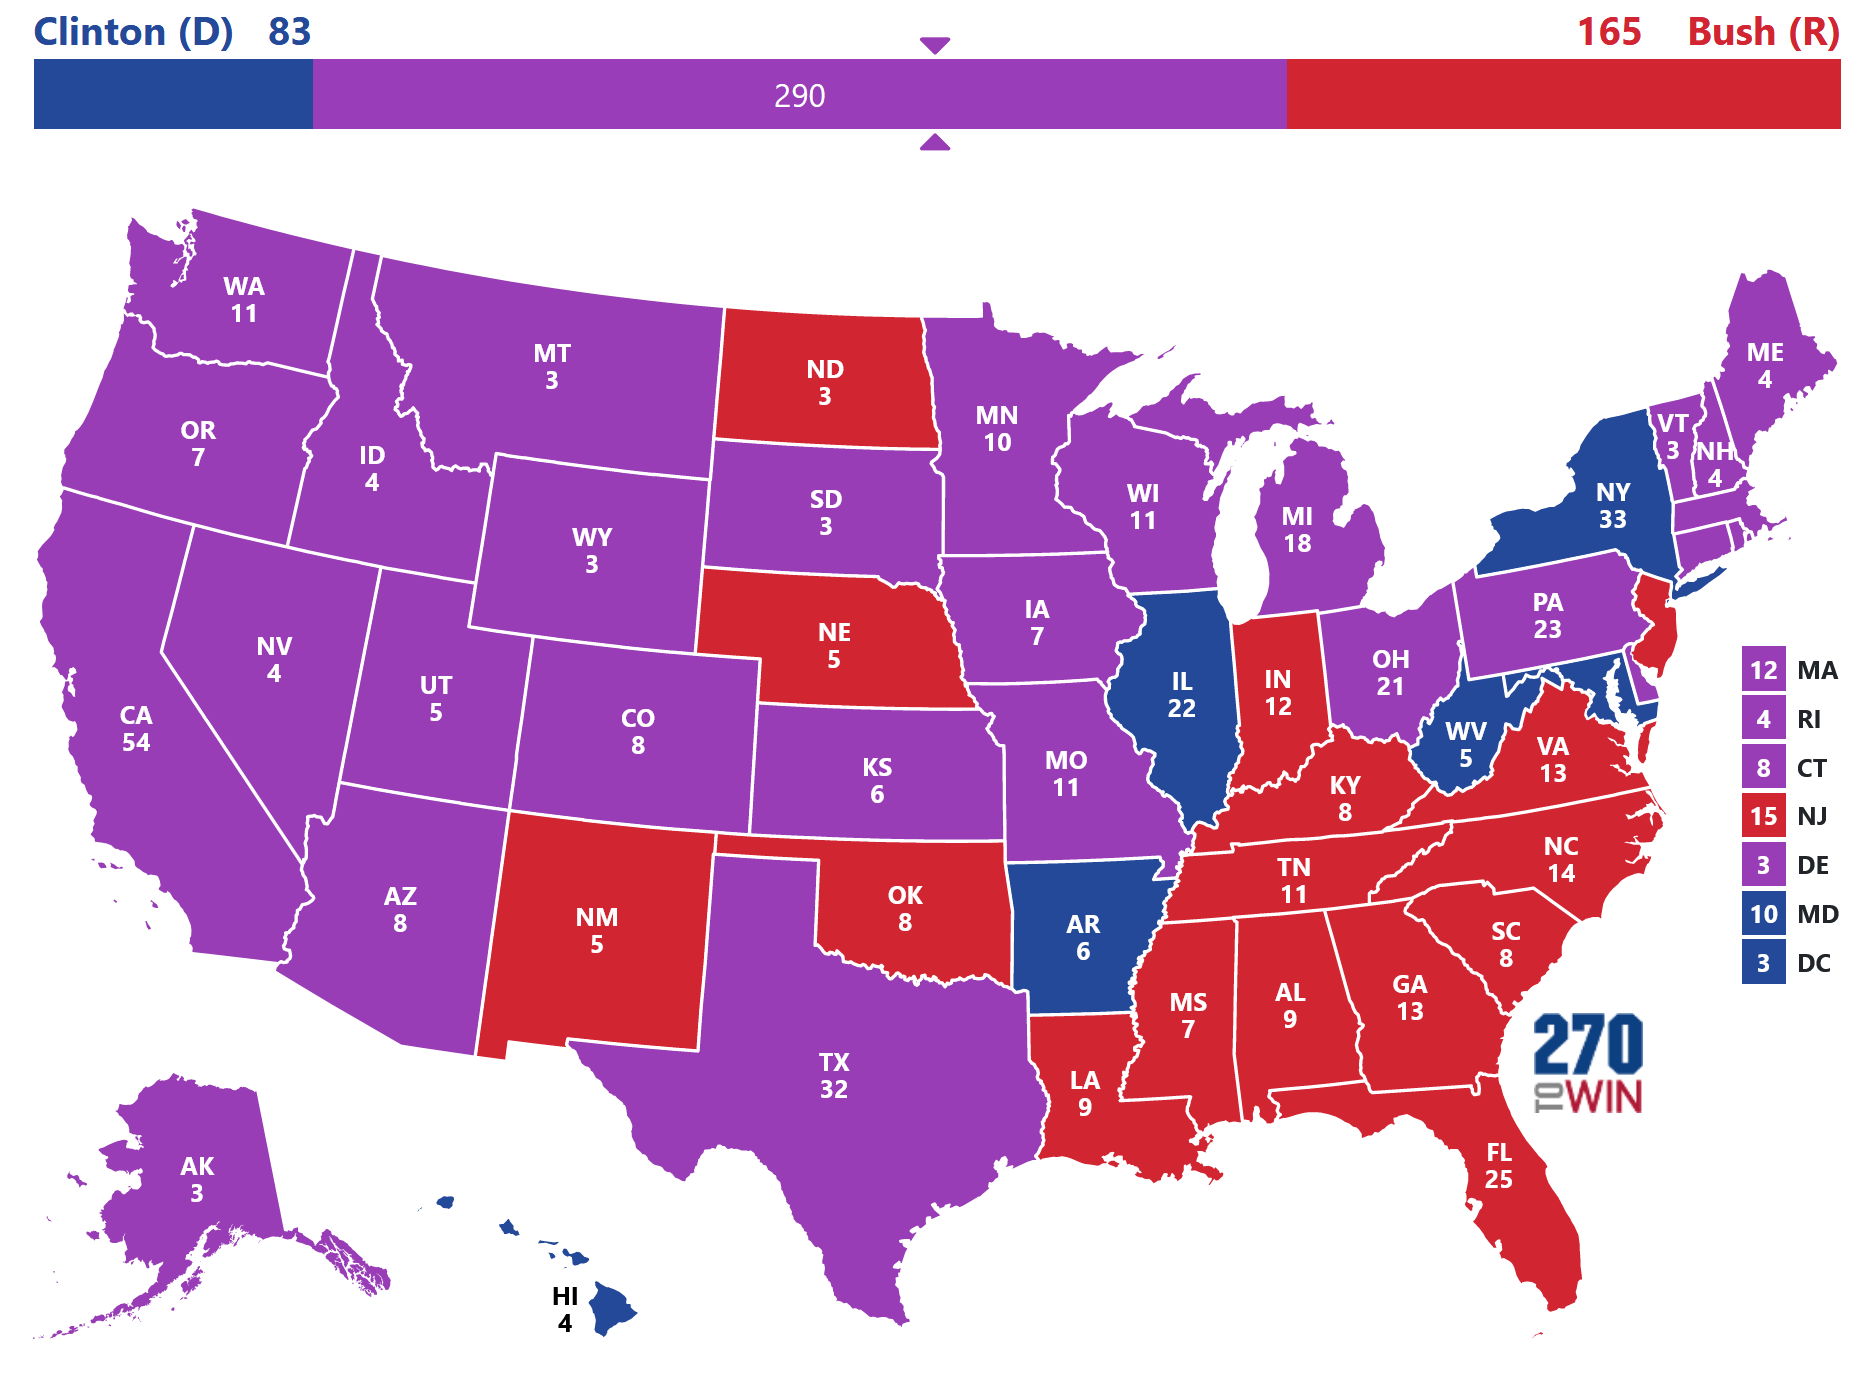
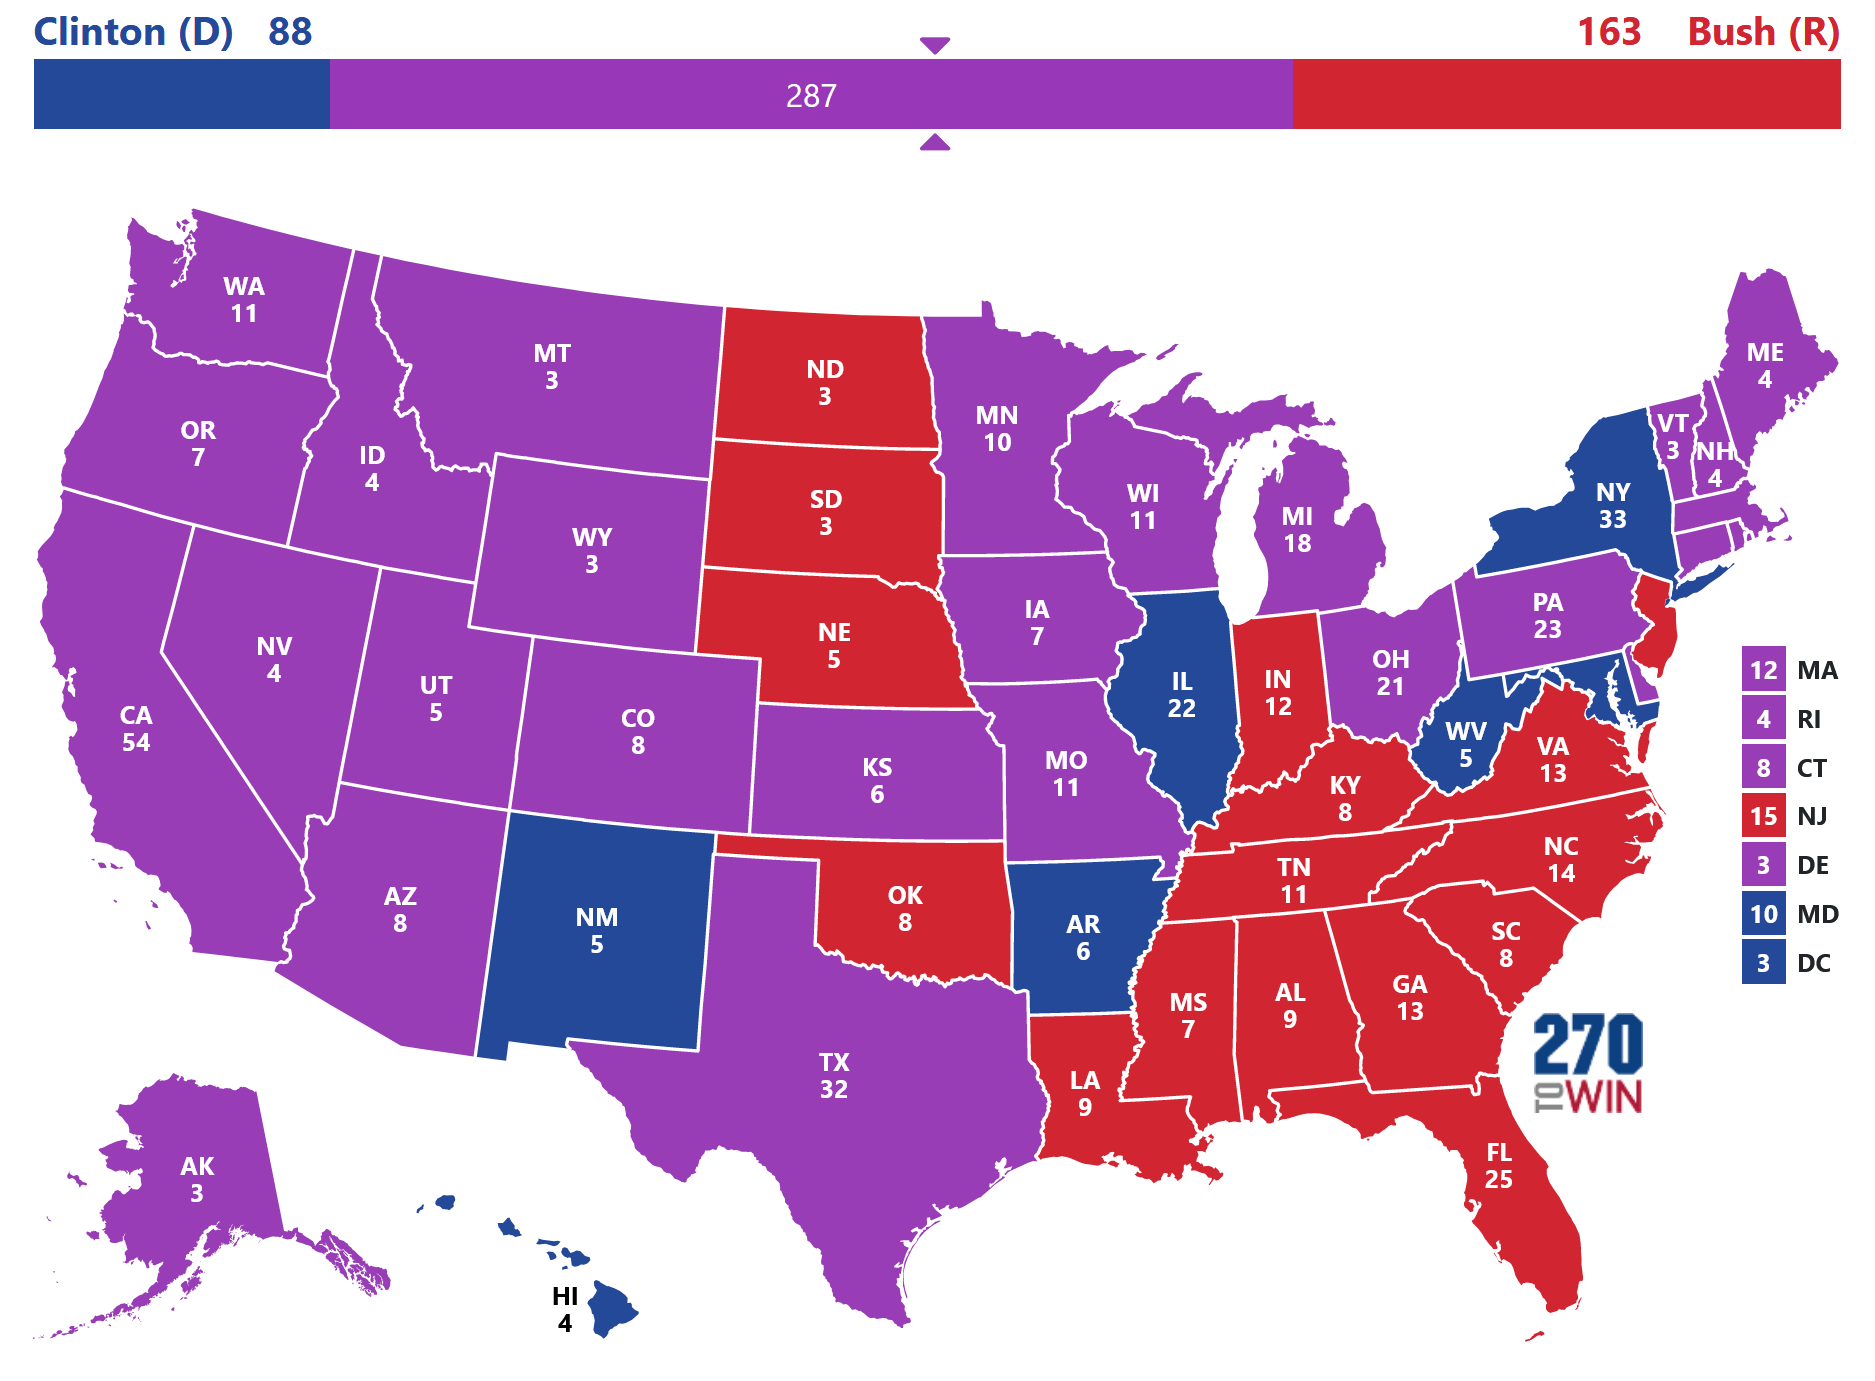
In some of the last polling available prior to Perot dropping out, we see a very tight race between Perot and Bush, with Clinton steadily gaining in the lead up to the Democratic National Convention.
Although some of these polls showed Perot in what would almost certainly be an election-losing position (around 20% of the popular vote, impressive for a third party but not enough on its own to win the Electoral College), here we’d like to examine some of the stronger late polling which, if replicated, could see Perot in a position to win the Presidency.
In particular, a late-June Gallup poll had Perot at 32%, just narrowly behind HW Bush at 33% while Clinton languished at 27% and 8% of voters reported being undecided.
Here, we reallocate undecided voters as follows:
- All other candidates combined gain 1%, not too far off from their actual 1992 total of 0.64%.
- Clinton gains 3%, as in the actual 1992 election he gained the most from here on out.
- Perot gains 3%, as in the actual 1992 election, he benefited significantly from the Presidential debates and also outperformed his polls on Election Day.
- HW Bush gains the remaining 1% of undecideds.
These reallocations give Perot a thin 1% margin over Bush, even as he wins quite comfortably in the Electoral College in either model:
Uniform swing model:
Elastic swing model:
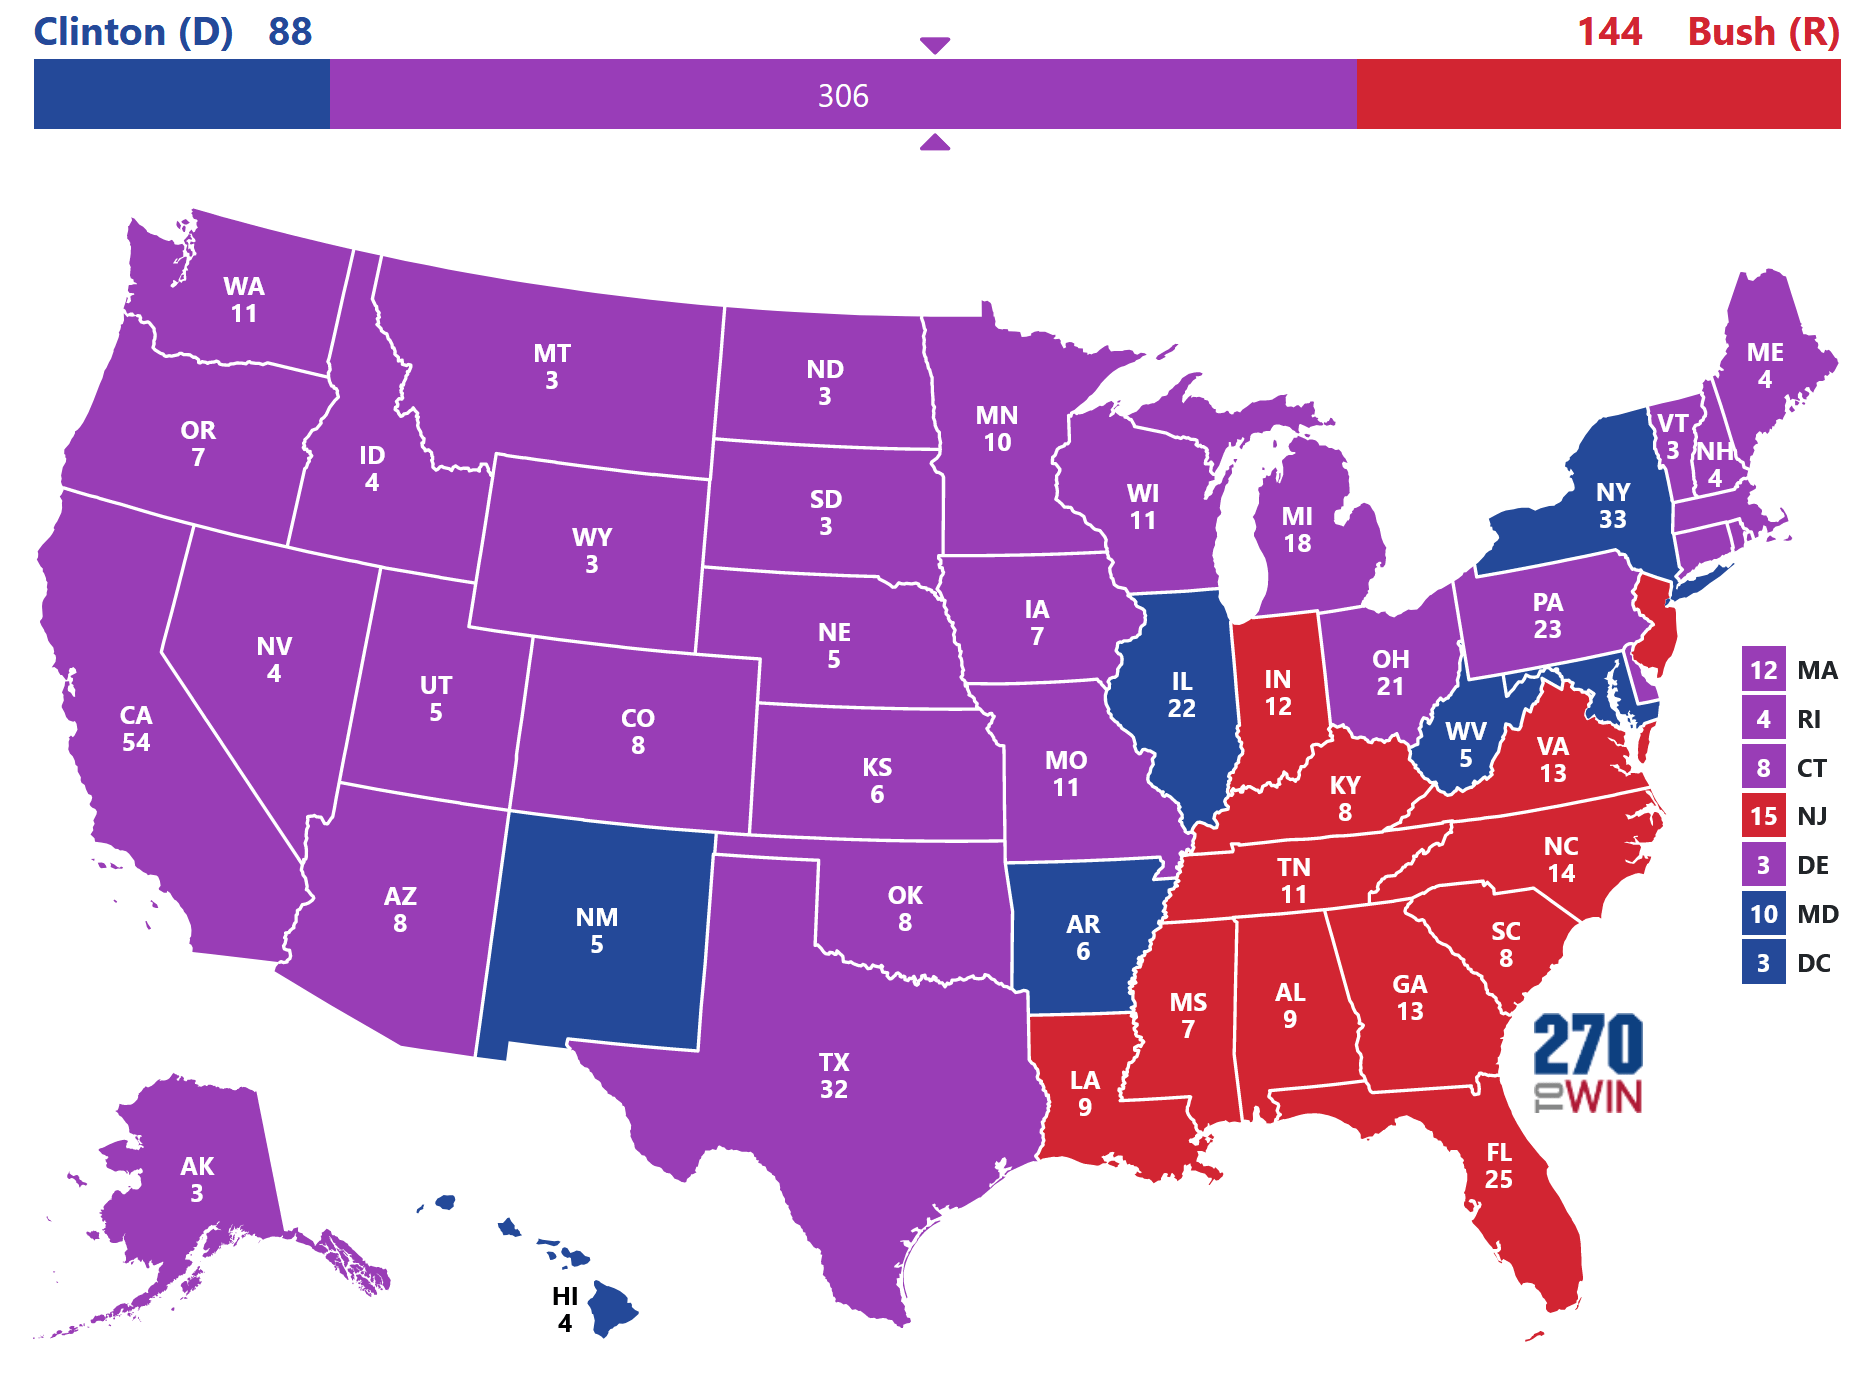
While winning about 57% of the Electoral College is somewhat above average for candidates who have a 1% margin on their nearest opponent, most such candidates typically win with over 40% of the vote in mostly two-way races, while here Perot would be elected off the preferences of just 35% of the electorate.
Although there are obviously many variations of the popular vote which would produce a very narrow Perot win in the Electoral College, here I want to demonstrate how Perot could have won with a relatively low share of the vote, even possibly without having to win a plurality.
For example, with just 34.15% of the vote, Perot could win a narrow Electoral College victory over his opponents in both the uniform and elastic swing models, although for demonstration purposes the map provided below is from the uniform swing model. (Bush 34.1%, Clinton 31.25%, Others 0.5%)
However, if we focus on the elastic swing model, we can see how Perot’s coalition is fairly well-configured for the Electoral College. In particular, in our simulations, he could have won despite narrowly placing third in the popular vote (Clinton 33.1%, Bush 33.5%, Perot 32.9%, Others 0.5%).
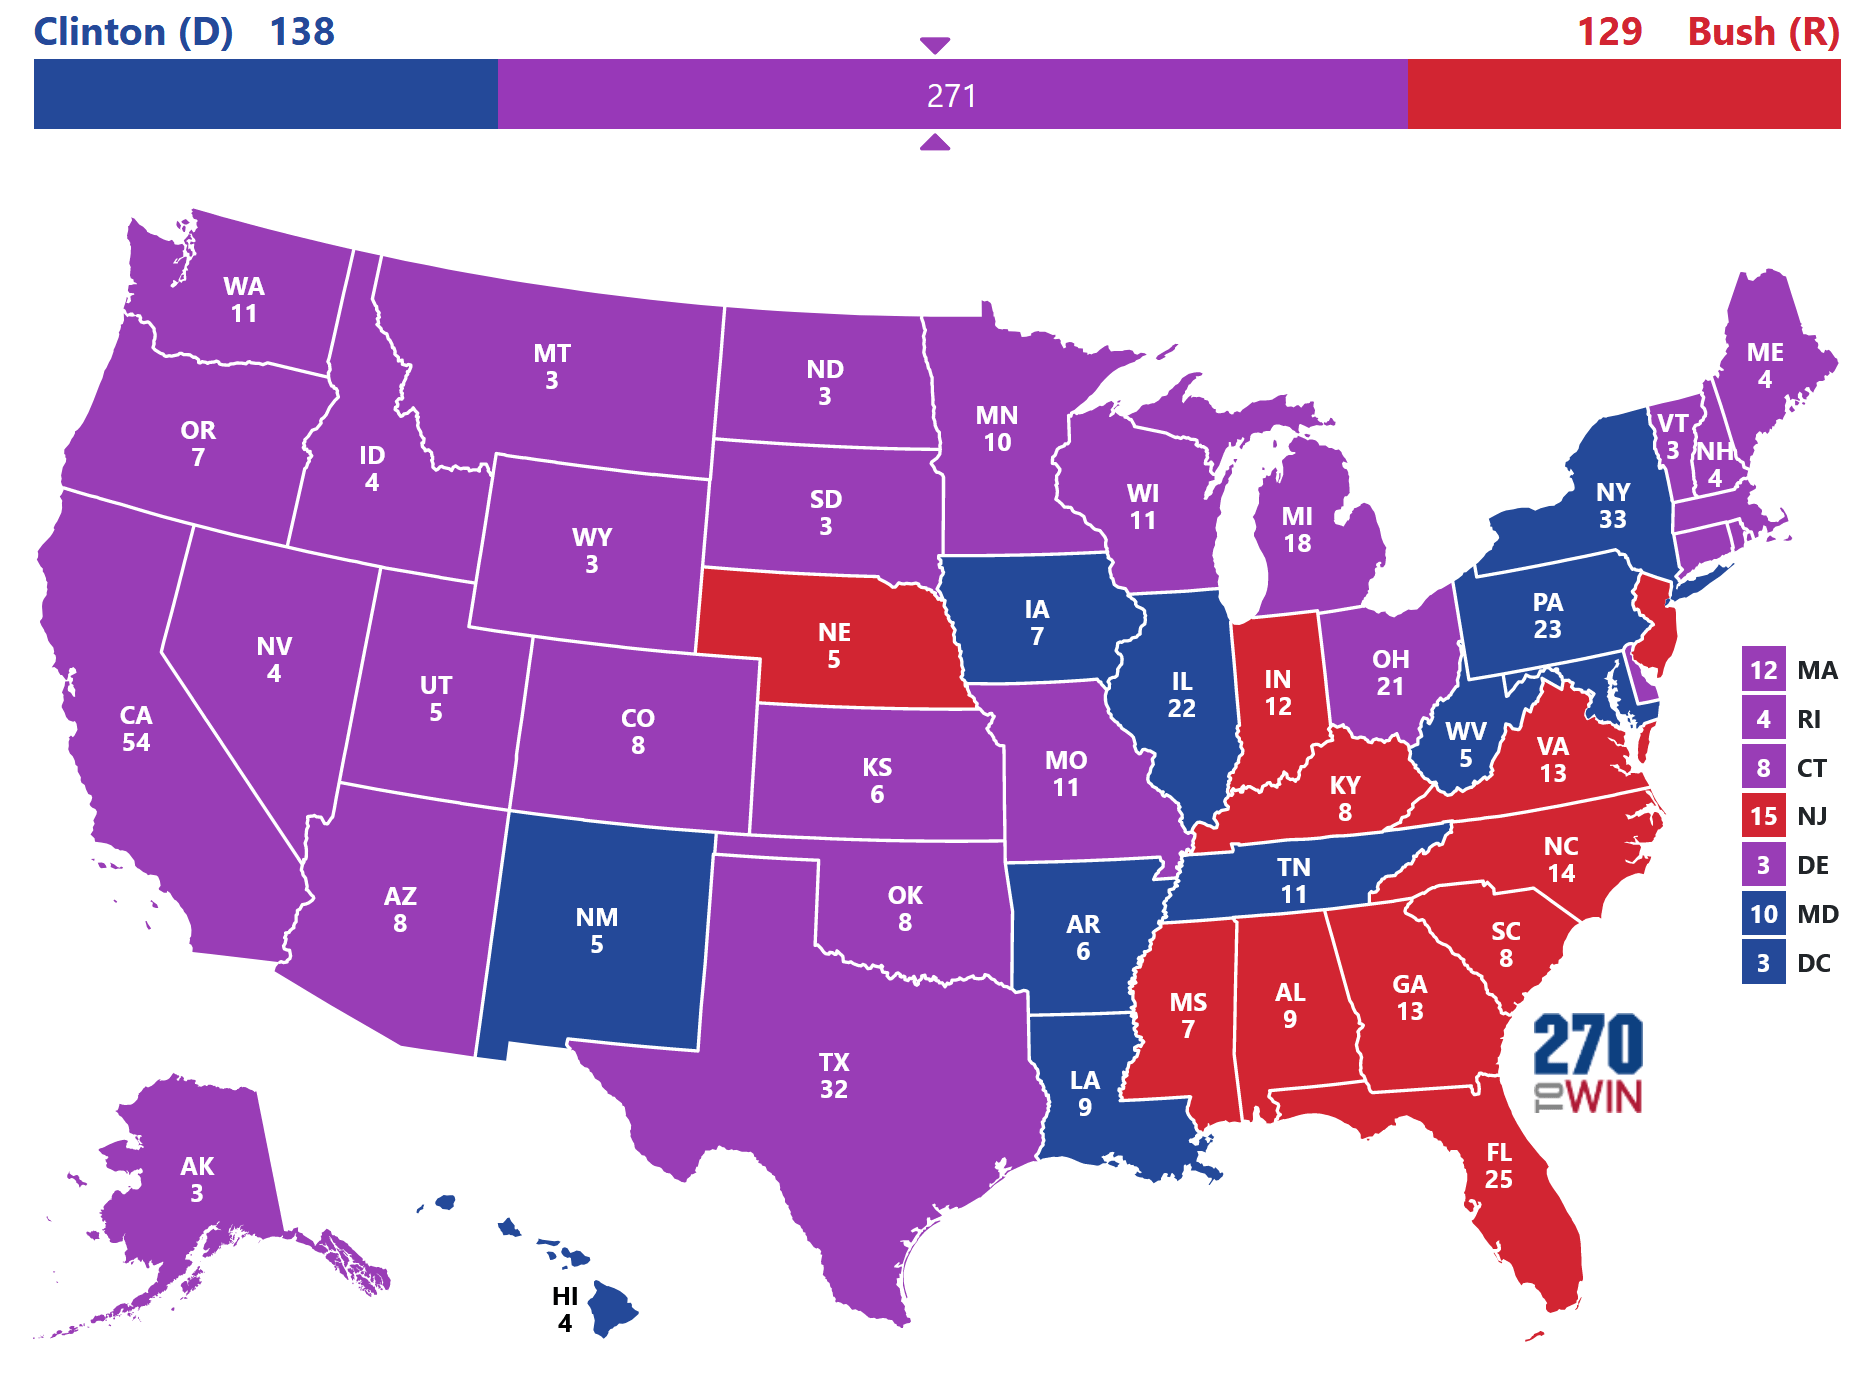
Note that these simulations are based off the relative leans (how much more or less of a state’s vote share Clinton/Bush/Perot won in comparison to their national vote share) of each state in the 1992 election. Hence, with very slight changes in his coalition, Perot may well have won with an even smaller share of the vote. If fewer of his gains are concentrated in states where he did well (e.g. Maine, Alaska) and are instead located in states needed for him to get to 270 EVs, it’s not implausible he could win with ~30% of the popular vote.
This is significant, as voting intention for many “significant” third-party candidates decline by about 5~10% from their peak by Election Day. Considering that Perot polled at ~40% at his peak, this suggests that he still had a viable path to victory even if the standard third-party decline had reduced his vote share by Election Day.
As the scenarios above demonstrate, a Perot loss was by no means a sure thing. Extrapolating from the coalition of voters who backed him in 1992, we see that Perot’s coalition is well-configured for a three-way dead heat; had he not dropped out and campaigned slightly differently, he might well have won the Presidency even without a plurality of the popular vote.