With the USA presidential election effectively over and Donald J. Trump having lost both the popular vote and the Electoral College, some minds are now turning to the future – examining, for example, the likely impact of the 2020 USA election for the 2022 USA midterms. Beyond the midterms, however, rumours are circulating that Trump could run again in 2024 for the presidency, which would put him in the rarefied company of just 10 losing Presidential candidates who made a repeat run for the office. Here, we have a look at those repeat bids to see if we can find any patterns for the likelihood of any such campaign by Trump.
A caveat: as we discuss in more detail below, each of these elections had their own peculiar set of circumstances which makes it hard to say with certainty how previous defeats affect a presidential campaign’s chances of winning. The data below should not be taken wholly at face value but rather be considered a “baseline”, which should be updated given the particular circumstances of USA politics come 2024.
There isn’t a very large sample size of repeat presidential candidates
(if you’re on a mobile device, scroll right for full data or turn your device landscape)
| Candidate | Initial defeat | Repeat run | Won? |
|---|---|---|---|
| Thomas Jefferson | 1796 | 1800 | Yes |
| Charles Pinckney | 1804 | 1808 | No |
| Andrew Jackson | 1824 | 1828 | Yes |
| Henry Clay | 1824 | 1832 | No |
| Henry Clay | 1824 | 1844 | No |
| Martin Van Buren | 1840* | 1848 | No |
| Grover Cleveland | 1888* | 1892 | Yes |
| William Jennings Bryan | 1896 | 1900 | No |
| William Jennings Bryan | 1896 | 1908 | No |
| Thomas Dewey | 1944 | 1948 | No |
| Adlai Stevenson | 1952 | 1956 | No |
| Richard Nixon | 1960 | 1968 | Yes |
| Overall win rate | 1 of 3 |
At first glance, there aren’t many repeat presidential candidates who managed to turn previous defeats into victory – of 12 repeat bids, just 4 succeeded, or about a third. However, this table glosses over a lot of complexity and circumstance in each bid. For example, two of the winners, Andrew Jackson and Grover Cleveland, actually won more votes than their opponents in their initial runs, having lost due to the vagaries of the USA Electoral College (a subject for another time). Furthermore, in some of these elections, we see multiple candidates winning either Electoral College votes and/or large chunks of the vote (defined here as >10%). A more nuanced analysis can be had by looking at the popular vote margin of each candidate during their losing and repeat bids:
Change in popular vote for repeat presidential candidates’ campaigns
(if you’re on a mobile device, scroll right for full data or turn your device landscape)
| Candidate | Initial margin | Repeat margin | Swing | Different opp.? | Switched parties? | Multiple major opponents? |
|---|---|---|---|---|---|---|
| Thomas Jefferson | -6.8 | 22.8 | 29.6 | No | No | No |
| Charles Pinckney | -45.6 | -32.2 | 13.3 | Yes | No | No |
| Andrew Jackson | 10.6 | 13.8 | 3.3 | No | Yes* | Yes, in initial loss |
| Henry Clay | -28.4 | -16.8 | 11.6 | No^ | Yes | Yes, in both runs |
| Henry Clay | -28.4 | -1.4 | 27 | Yes | Yes** | Yes, in initial loss |
| Martin Van Buren | -6.1 | -37.2 | -31.1 | Yes | Yes | Yes, in repeat bid |
| Grover Cleveland | 0.8 | 3 | 2.2 | No | No | Yes, in repeat bid |
| William J. Bryan | -4.3 | -6.1 | -1.8 | No | No | No |
| William J. Bryan | -4.3 | -8.6 | -4.3 | Yes | No | No |
| Thomas Dewey | -7.5 | -4.5 | 3 | Yes | No | Yes, in repeat bid |
| Adlai Stevenson | -10.9 | -15.4 | -4.5 | No | No | No |
| Richard Nixon | -0.2 | 0.7 | 0.9 | Yes | No | Yes, in repeat bid |
| Average | -10.9 | -6.8 | 4.1 |
*, **: Although both Andrew Jackson and Henry Clay ran as members of different parties from their initial bids, in both cases the ‘new’ party was highly similar to the ‘old’ faction/party they ran on, which means these really shouldn’t be considered wholesale party switches
From the table above, we can see that, on average, repeat presidential candidates improved on their losing margin by about 4%. However, like the first table, this generalization glosses over lots of unique circumstances in each election; ranging from Van Buren switching to a minor party (producing the 31% swing against him), to the drop-off in Southern support for the Democrats which powered Nixon’s comeback win, or the politics of the French Revolution and the Alien and Sedition Acts which helped produce Jefferson’s nearly-30 point surge to victory.
Additionally, many candidates faced different opponents, which could have shifted the contours of the campaign (e.g. by removing incumbency as a factor). This leads into another point, one of selection bias. Generally, defeated major party candidates aren’t too willing to run when they think they might lose; this might produce a larger-than-expected swing to them as defeated candidates avoid repeat runs during unfavourable times for their party.
There’s also a point to be made that the large swings tend to be earlier; no candidate has seen double-digit swings in their vote margin since the 1800s. This may be relevant to considering the chances of a potential Trump 2024 bid, as the current political scene in the USA is highly polarised and thus a double-digit swing to or against Trump is highly unlikely. If we only consider bids made 1900 or later, the average swing is about -0.6%, which is fairly negligible swing against the repeat candidate.
What this means for a Trump 2024 bid
A Trump 2024 bid would have few similarities with most of the repeat runs listed above, save perhaps one: Martin Van Buren, who lost the popular vote by about 6% as the incumbent president (Trump currently trails by 5%). However, Van Buren opted to run on a minor party ticket, a decision which saw his vote plummet and one which Trump is unlikely to make, given his continued strong support amongst Republican voters. Additionally, Van Buren won a majority of the popular vote in his first run with a 14% margin on his opponent, something which Trump did not achieve.
Looking at the long-run data, if we take the average of all swings in repeat campaigns (4%, to repeat candidate), a Trump 2024 bid looks highly favourable for the current President. Although he would still lose the popular vote, a uniform swing of 4% would return the states of the industrial Midwest plus Georgia and Arizona to Trump, in addition to possibly picking up Nevada.
Most of these margins would be very close, with Michigan, Pennsylvania and Nevada all being under a point. Having said that, this would be a highly favourable map for Trump, not too dissimilar from his 2016 Electoral College victory.
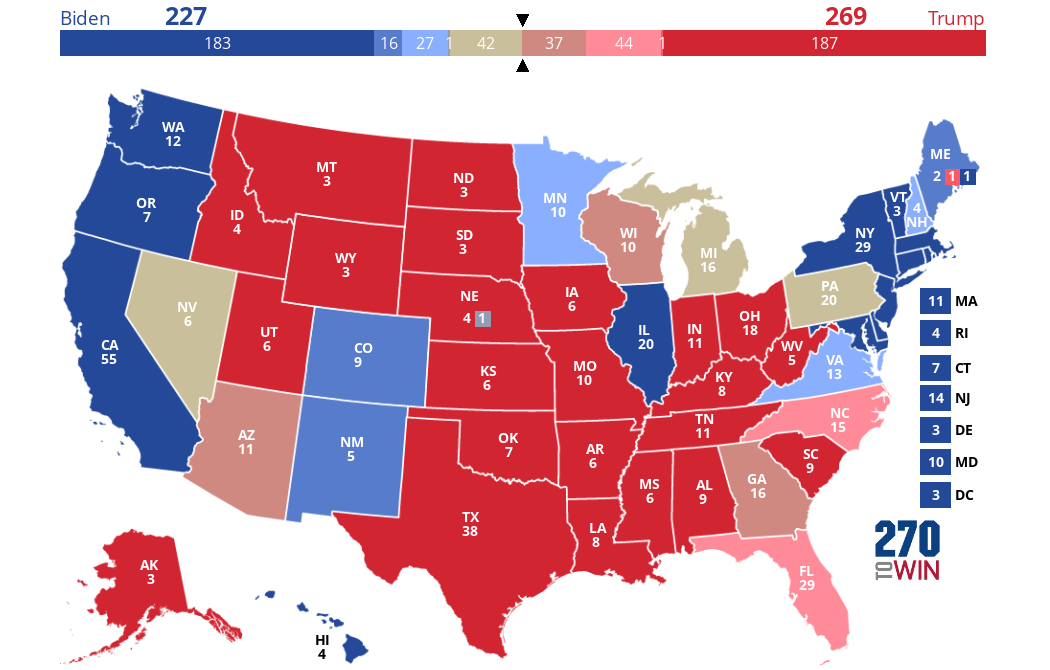
On the other hand, if we only consider repeat bids made 1900 or later, i.e. a swing against Trump of 0.6%, the Electoral College looks like much more of a tossup:
Hence, although only a third of repeat USA presidential candidates have succeeded in their campaigns, the average swing combined with the 2020 Electoral College map suggest Trump is more likely than not to outperform his 2020 performance in a potential 2024 bid, though the data from more recent elections is more mixed. As both Electoral College maps show, however, unless Biden wins in a landslide or shifts the contours of the Electoral College, a repeat Trump bid still has a good shot at winning the Electoral College, even if he does not win the popular vote.